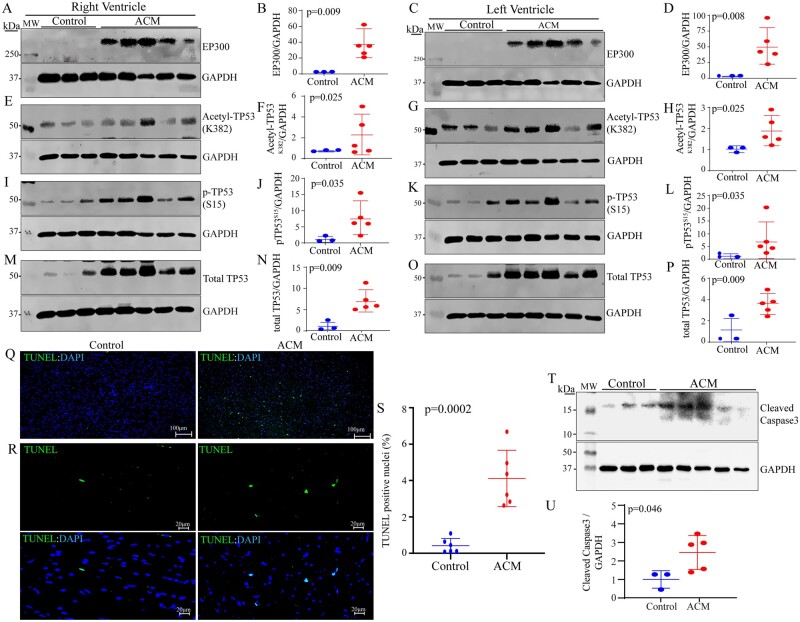
Figure 5.
Activation of the EP300-TP53 pathway in the ACM hearts. (A–P) Immunoblots showing increased levels of EP300 proteins, acetyl-TP53 (K382), phospho (S15)-TP53, and total TP53 in the right and left ventricular samples in the ACM hearts as compared to controls. The corresponding quantitative data, normalized to GAPDH, are shown next to each panel. (Q–R) Increased myocardial apoptosis in the ACM hearts as compared to controls (Q: low magnification and R: high magnification). The corresponding quantitative data are shown in S. (T–U) Immunoblots showing increased levels of the cleaved (activated) Caspase 3 (CASP3) and the corresponding loading control GAPDH in the ACM hearts (T). Quantitative data are shown in U.

