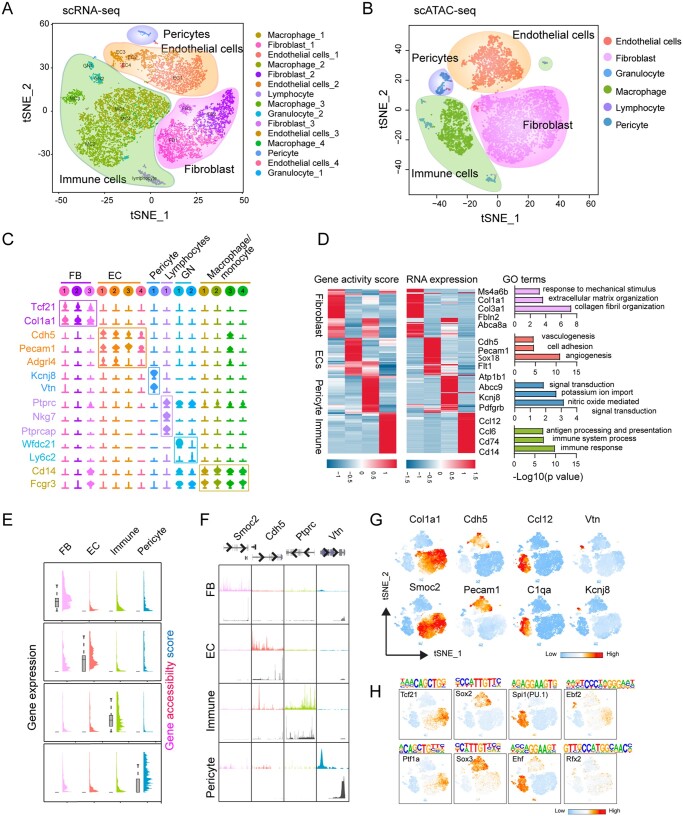
Figure 1.
Integrated single-cell transcriptomic and epigenomic analysis of non-cardiac (non-CM) cells. (A) Unsupervised clustering demonstrates 15 distinct cell types shown in a t-SNE plot. Non-CMs (n = 12 779) were obtained from two adult hearts. (B) t-SNE plot of major cell types captured by scATAC-seq (n = 9524). (C) Violin plots showing the relative expression levels of representative marker genes across the 15 main clusters. (D) Heatmaps showing the promoter accessibility and the corresponding gene expression of differentially expressed genes (DEGs) in four major non-CM cell populations. Representative gene ontology (GO) terms of the DEGs obtained from scRNA-seq were shown at the right side. (E) Plots showing the gene accessibility score (coloured peaks) and expression levels (grey boxes) of the scRNA-seq derived cell-type signature genes for major non-CM clusters including fibroblasts (FBs), endothelial cells (ECs), pericytes and immune cells. (F) Aggregate chromatin accessibility (colour peaks) and gene expression (grey peaks) profiles for each cell cluster at representative marker gene loci (Smoc2 for FBs, Cdh5 for ECs, Ptprc for immune cells and Vtn for pericytes). (G) t-SNE plot showing the differential accessibilities of representative marker genes for major non-CM clusters. (H) t-SNE plot showing the differentially enriched transcription factor (TF) binding motifs among major non-CM clusters.

