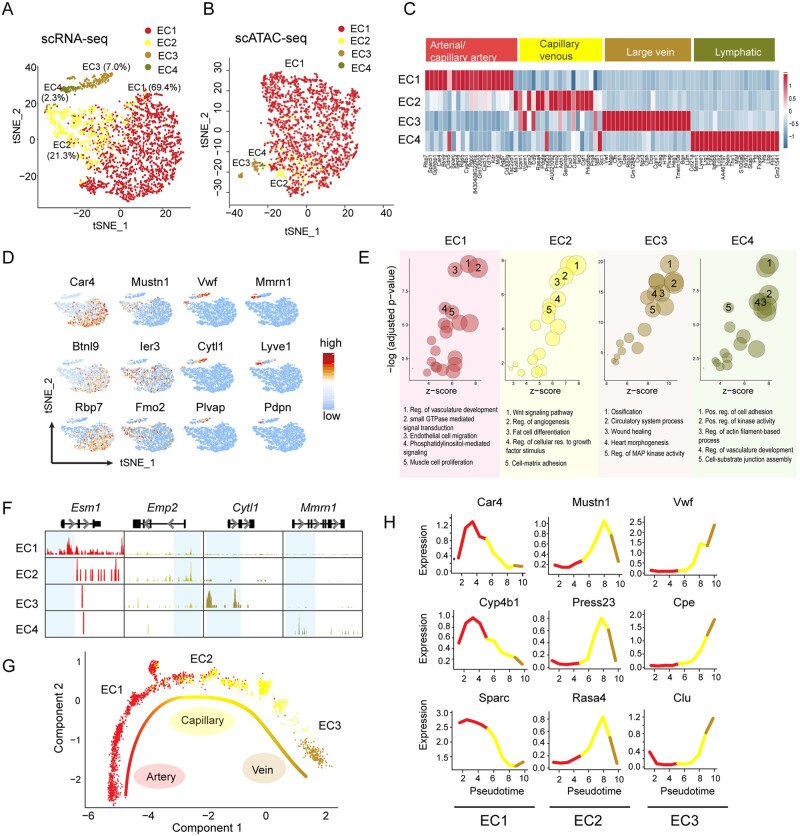
Figure 2.
Characterization of endothelial cell subpopulations from cardiac non-myocytes. (A) t-SNE plot showing subpopulations of ECs from scRNA-seq. EC cells (n = 2939) were subclustered into four subsets and the percentage of each subcluster was shown. (B) t-SNE plot showing subpopulations of ECs from scATAC-seq (n = 2287). (C) Heatmap of top 20 DEGs in each EC subcluster that re-define ECs into arterial/capillary artery ECs, capillary venous, large vein and lymphatic ECs. (D) t-SNE plot showing expression of representative markers in individual EC sub-clusters. (E) Genome track showing the chromatin accessibility profiles of the representative markers in each EC subcluster. EC subcluster specific peaks were highlighted in blue. (F) Enriched GO terms of each EC sub-types using DAR nearby genes. Top five non-redundant GO terms were shown as representatives. Reg, regulation; pos, positive; res, response. (G) Trajectory analysis of the ECs forming blood vessels. (H) Expression profile of marker genes differentially expressed along the trajectory in EC sub-clusters forming blood vessels.

