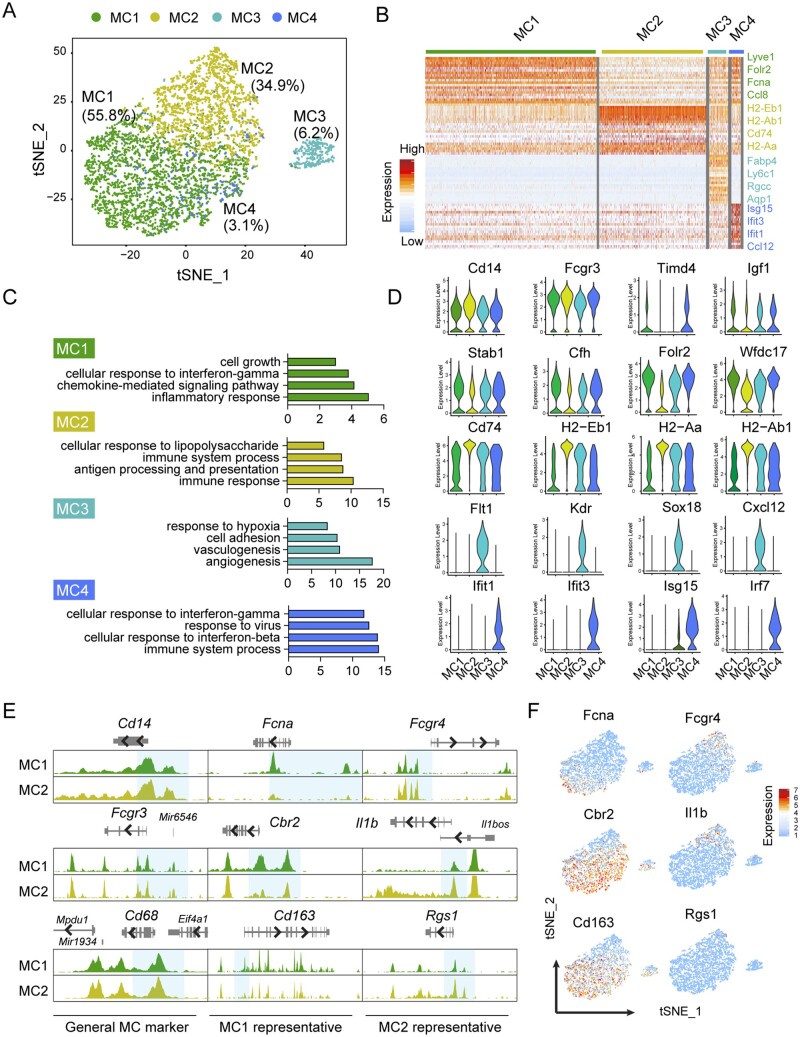
Figure 3.
Characterization of macrophages/monocytes from cardiac non-myocytes. (A) t-SNE plot showing 4 macrophage/monocyte (MC) sub-types (n = 5532) from non-CMs. (B) Heatmap showing expression of top 30 DEGs in each MC sub-type. (C) GO terms enriched for each MC sub-type. (D) Violin plot showing the expression of the representative genes in each MC sub-type. (E) Genome tracks showing the chromatin accessibility profiles of the representative marker genes for the two major MC sub-type (MC1 and MC2). Differentially accessible regions near promoter were highlighted in blue. (F) t-SNE plot showing the expressions of representative marker genes for different MC sub-types.

