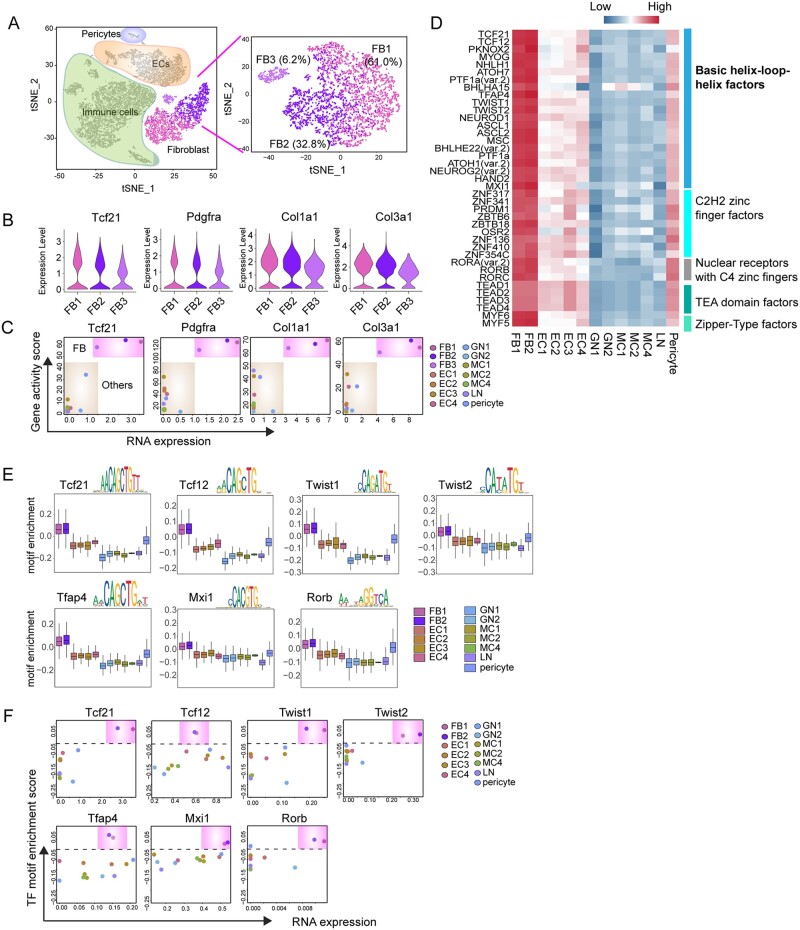
Figure 4.
Cis- and trans-regulatory elements of cardiac fibroblast. (A) Unsupervised clustering of FBs (n = 3459) by Seurat demonstrating three FB sub-types. (B) Violin plot showing the relative expression of canonical FB marker genes in three FB sub-types. (A) X–Y plots showing the gene expression levels (X-axis) and the gene accessibility score (Y-axis) of canonical FB marker genes. (D) Heatmap showing the motif enrichment scores for TF motifs highly enriched in FB sub-types. (E) Box plot showing the enrichment scores for seven representative TF motifs that are specifically enriched and highly expressed in FB population. (F) X–Y plots showing the gene expression levels and TF motif enrichment scores of FB-specific TFs.

