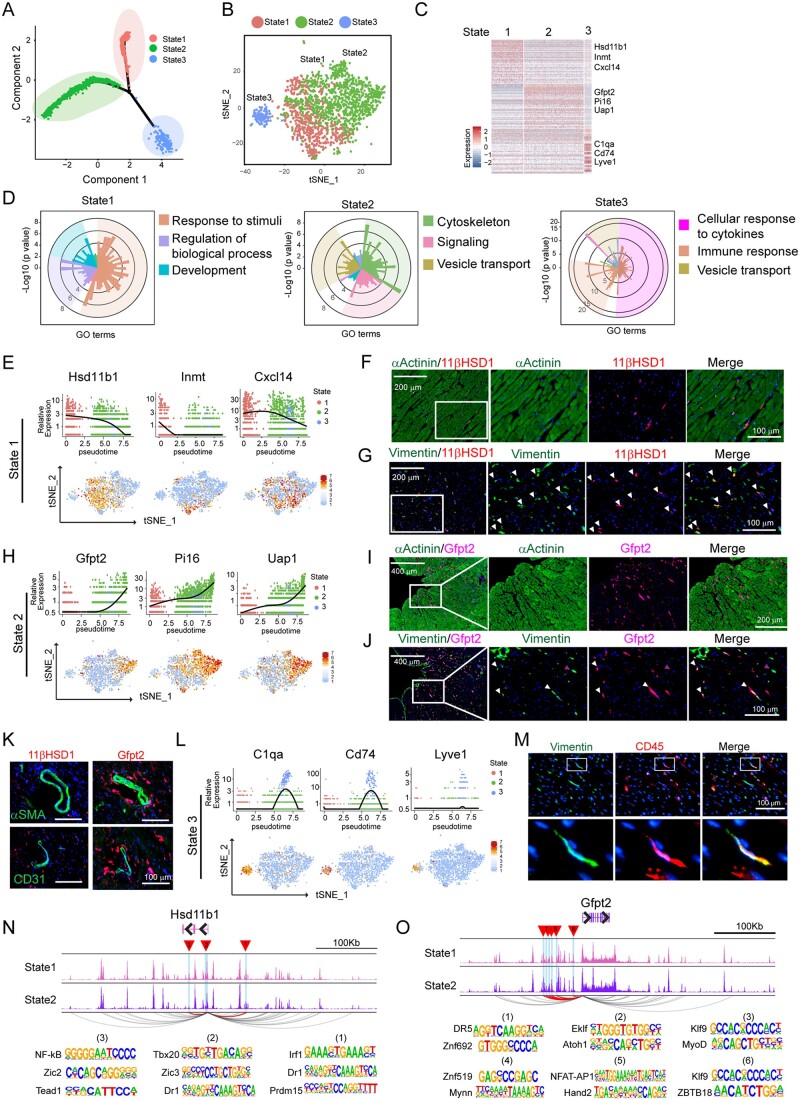
Figure 5.
Heterogeneity of fibroblast reflected by three subpopulations in distinct functional states. (A) Ordering single fibroblast cells along a cell state trajectory using Monocle (n = 2048). (B) Projection of FBs in three state into t-SNE plot clustered by Seurat. (C) Heat map showing a subset of transcripts that are enriched in each functional state. Three representative genes were listed. (D) Top 3 enriched GO categories analysed from DEGs of each cell state. In each panel, each histogram represents a GO term, the height of the bar indicates the P-value, and the colour indicates similar functional GO categories. GO terms of similar biological function were gathered as a function group, representative GO terms were shown and followed by a P-value. (E) Representative gene expression in State 1 FB shown in total fibroblast population along pseudotime trajectory (upper panel) and their distribution in major cell populations in t-SNE plot (bottom panel). (F) Representative immunohistochemistry (IHC) images showing 11βHDS1+αActinin-State 1 FBs. (G) Representative IHC images showing the identification of State 1 FB positive for both 11βHDS1 and Vimentin (white arrowhead). (H) Representative gene expression in State 2 FB shown in total fibroblast population along pseudotime trajectory (upper panel) and their distribution in major cell populations in t-SNE plot (bottom panel). (I) Representative IHC images showing Gfpt2+α-Actinin-State 2 FBs. (J) Representative IHC images showing the identification of State 2 FB positive for both Gfpt2 and Vimentin (white arrowhead). (K) Representative IHC images showing the co-staining of 11βHDS1+ and Gfpt2+ cells with either αSMA or CD31. (L) Representative gene expression in State 3 FBs shown in total FB population along pseudotime trajectory (upper panel) and in major cell populations in tSNE plot (bottom panel). (M) Representative IHC images showingV the identification of FB (state 3) positive for both CD45 and Vimentin. (N,O) Genome track of the Hsd11b1 (N) and Gfpt2 (O) loci. Predicted promoter-enhancer interactions of statistical significance (P-value < 0.05) are shown in arcs, where the interactions involving differentially accessible regions (DARs; highlighted in blue, as well as red triangles) are highlighted in purple, and the others are in gray. For panels F, G, I, J, K, and M, n = 3 hearts were used, and n = 4 sections at different positions from each heart were stained for indicated protein.

