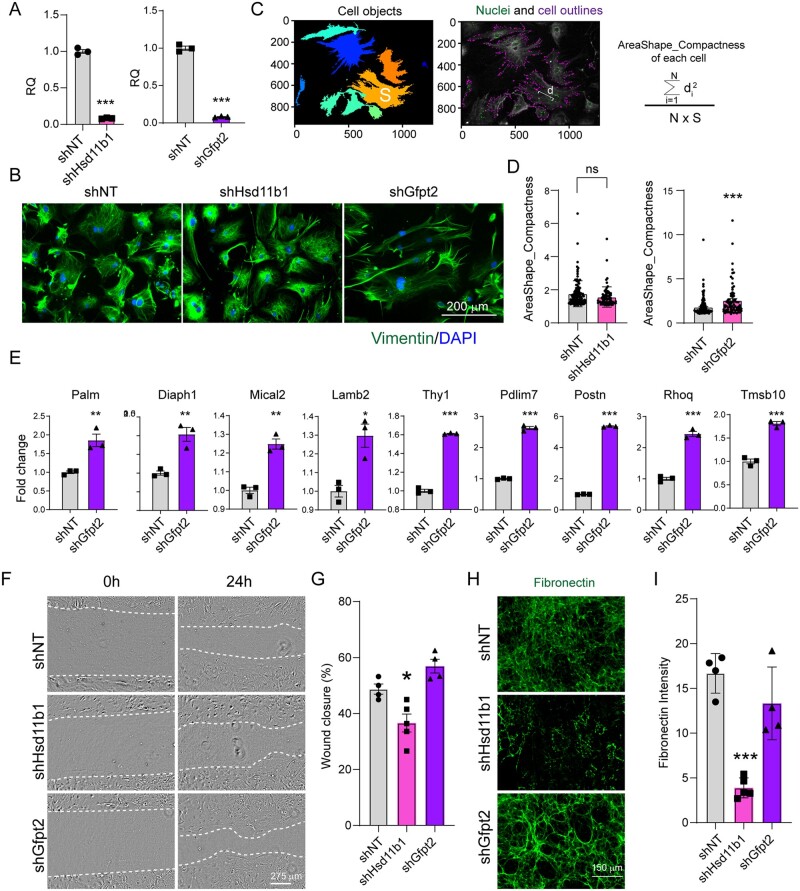
Figure 6.
Effects of Hsd11b1 and Gfpt2 knockdown on cardiac fibroblasts in vitro. (A) Knockdown efficiency of Hsd11b1 and Gfpt2 evaluated by RT-qPCR. Lenti-viral shRNAs targeting Hsd11b1, Gfpt2 and non-targeting control (shNT) were individually introduced to FBs isolated from 3 m adult hearts. Three days post-viral infection, cells were collected for qPCR. This experiment was repeated three times with n = 5 hearts and averaged numbers from technical triplicates were used for statistics. Error bars indicate mean ± s.e.m; *** P < 0.001. (B) Representative ICC images showing the morphology of cultured FBs upon shHsd11b1 and shGfpt2 treatment. (C) Representative images and formula showing the parameters of area (S) and distance (d) for measuring cell compactness using Cellprofiler. (D) Histogram showing the cell compactness changes upon shHsd11b1 and shGfpt2 treatment in comparison with shNT control. In left panel, n = 112 for shNT, and n = 73 for shHsd11b1; in right panel, n = 146 for shNT and n = 76 for shGfpt2. (E) Quantification of the expression of genes involved in cytoskeleton organization in FBs treated with shNT or shGfpt2 by qPCR. This experiment was repeated three times with n = 5 hearts each time. Averaged numbers from technical triplicates were used for statistics. Error bars indicate mean ± s.e.m; * P < 0.05, ** P < 0.01, ***P < 0.001. (F,G) Representative light microscopic images (F) and quantification (G) of cardiac FB migration at 0 h and 24 h after scratching. (H,I) Representative ICC images (H) and quantification (I) showing the deposition of fibronectin in FBs treated with shRNAs targeting Hsd11b1, Gfpt2, and the non-targeting control. For panels (F–I), the experiments were repeated three times in technical duplicates using n = 3 hearts each time. In each replicate, n = 4–5 individual fields were taken and calculated for statistics. Error bars indicate mean ± s.e.m; * P < 0.05, ** P < 0.01, *** P < 0.001.

