Figure 1.
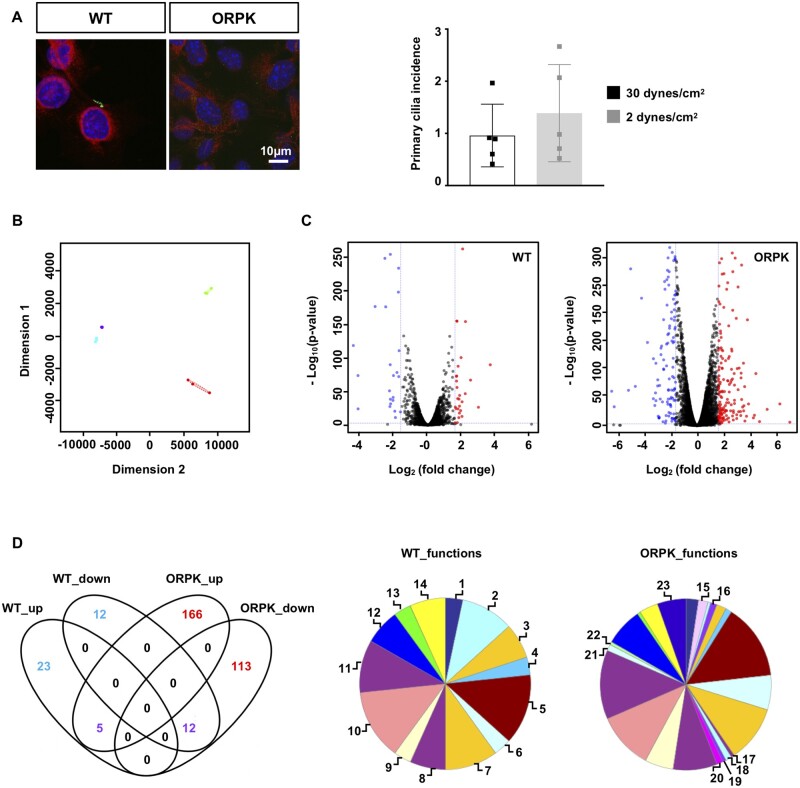
Primary cilia regulate gene expression in response to aneurysmal flow. (A) Acetylated α-tubulin staining for primary cilia (green) in wild-type (WT) and Tg737orpk/orpk (ORPK) ECs. Nuclei were stained with DAPI (blue), and cells were counterstained with Evans blue (red). Quantification of primary cilia in WT ECs after 48h exposure to a WSS of 30 or 2 dynes/cm2. Mean ± SD; unpaired t-test. Results are obtained from five independent experiments. (B) Multidimensional scaling plot representing similarities in gene expression between WT and ORPK ECs. WT: violet = 30 dynes/cm2, blue = 2 dynes/cm2. ORPK: green = 30 dynes/cm2, red = 2 dynes/cm2. Results are obtained from three independent experiments. (C) Volcano plot displaying differential expressed genes under 2 dynes/cm2 vs. 30 dynes/cm2 in WT and ORPK ECs. Red and blue dots represent the up- and down-regulated genes, respectively. (D) Venn diagram showing the number of WSS-induced differentially expressed genes in WT and ORPK ECs. Colours represent differentially expressed genes in presence (blue), absence (red), or independent (purple) of primary cilia. Pie charts of differentially expressed genes in WT and ORPK ECs based on Gene Ontology functional protein class. 1 = calcium binding; 2 = cell junctions; 3 = cytoskeletal; 4 = defence/immunity; 5 = enzyme modulators; 6 = extracellular matrix; 7 = hydrolases; 8 = nucleic acid binding; 9 = oxidoreductases; 10 = receptors; 11 = signalling molecules; 12 = transcription factors; 13 = transfer/carriers; 14 = transferases; 15 = cell adhesion; 16 = chaperones; 17 = isomerases; 18 = ligases; 19 = lyases; 20 = membrane trafficking; 21 = storage; 22 = structural; 23 = transporters.

