Figure 5.
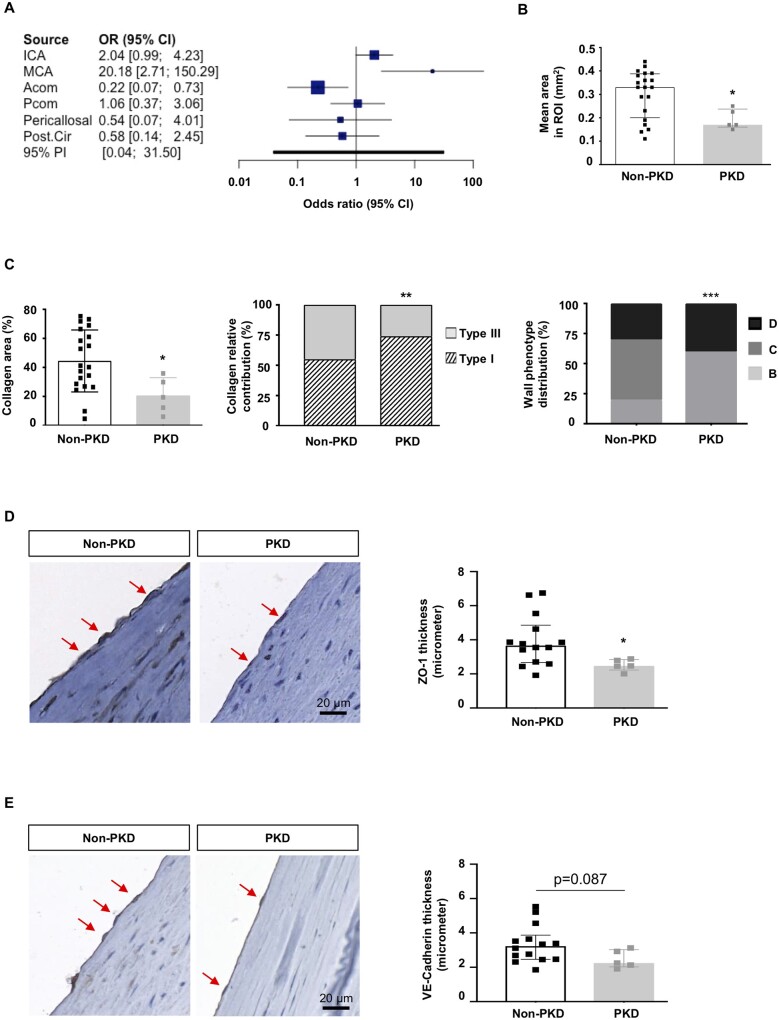
Characterization of IA domes of PKD and non-PKD patients. (A) Distribution and likelihood ratio of IA distribution between PKD and non-PKD patient groups (925 patients with 1076 IAs). (B) Mean surface area, measured in three to four regions of interest (ROI) covering almost the entire surface of the PKD (N = 5) and non-PKD (N = 20) IA dome sample. Median ± IQR. (C) Total collagen (left), relative distribution of type I and III collagen (middle), and distribution of severity grades (right) in PKD (N = 5) and non-PKD (N = 20) IA dome samples. Median ± IQR (left) or % (middle, right). (D) ZO-1 immunostaining (left images; in brown, some positive ECs are indicated by arrow) and quantification (right, Median ± IQR) on PKD (N = 5) and non-PKD (N = 14) IA dome samples. (E) VE-cadherin immunostaining (left images; in brown, some positive ECs are indicated by arrow) and quantification (right, Median ± IQR) on PKD (N = 5) and non-PKD (N = 14) IA dome samples. *P < 0.05; **P < 0.01; ***P ≤ 0.001. Comparison of medians and distributions has been performed using non-parametric Mann–Whitney U-test and chi-square test, respectively.

