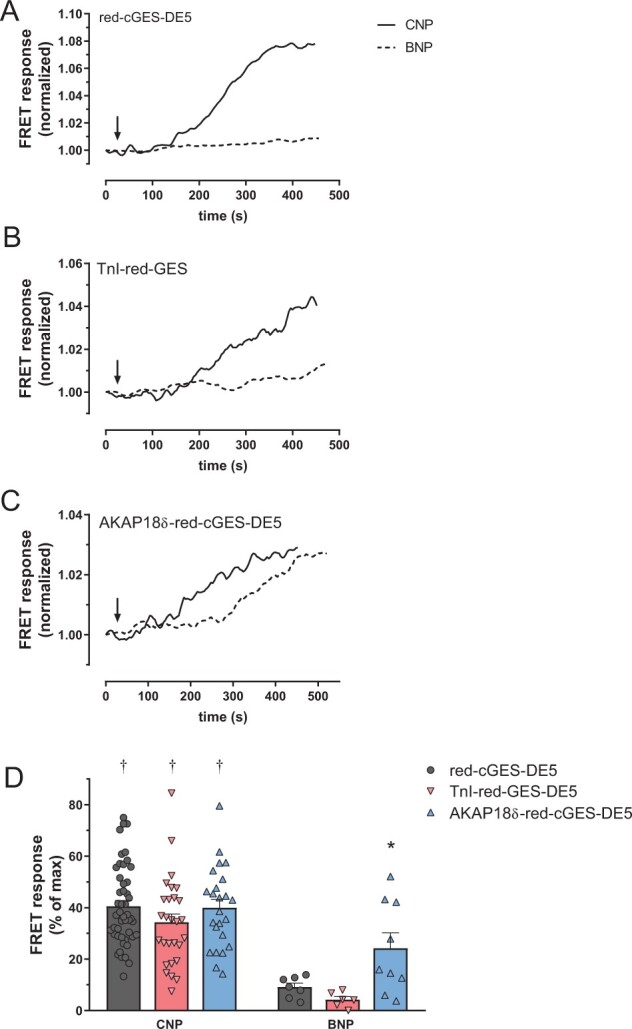
Figure 3.

Differential GC-A and GC-B activities in adult cardiomyocytes. (A–C) Representative single-cell FRET responses from adult cardiomyocytes expressing the indicated red-cGES-DE5 biosensor and stimulated with CNP (300 nM) or BNP (300 nM) where indicated. Responses were normalized to signal prior to stimulation. (D) Quantification of FRET responses to CNP or BNP with the indicated biosensor. Responses are shown as per cent relative to maximal FRET (for CNP: subsequent addition of IBMX, for BNP: subsequent addition of IBMX and CNP) for each biosensor. Data are mean ± SEM from 6 to 48 cells from 5 to 15 animals. *P < 0.05 AKAP18δ-red-cGES-DE5 vs. TnI-red-cGES-DE5 (two-way ANOVA with Sidak’s multiple comparison test). †P < 0.05 CNP vs. BNP with identical biosensor (two-way ANOVA with Sidak’s multiple comparison test).
