Figure 7.
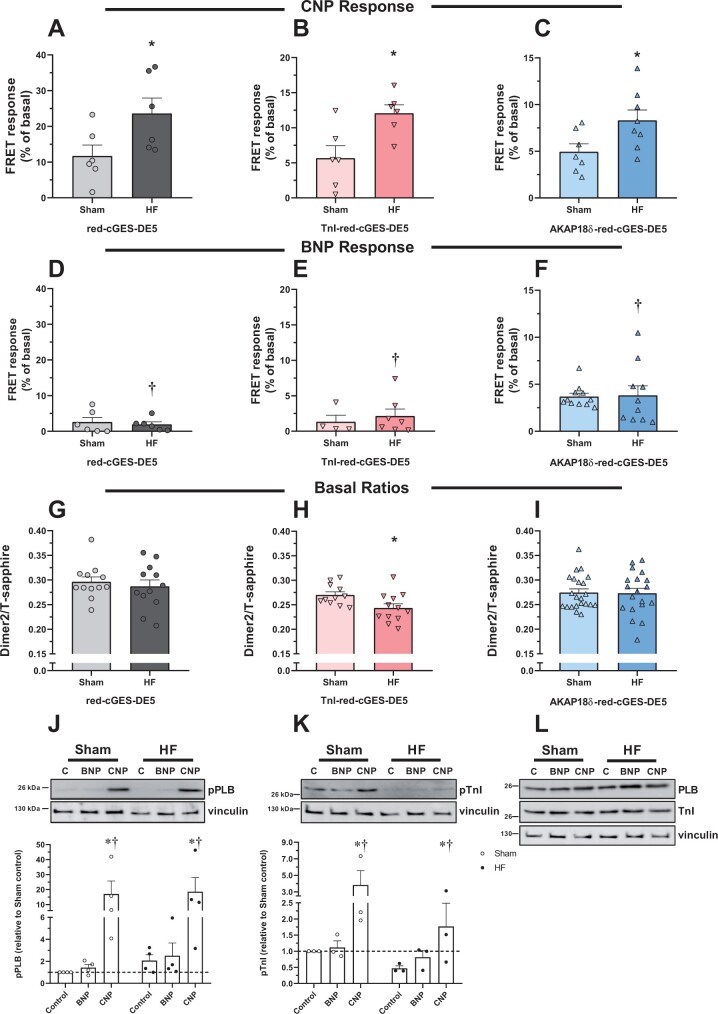
cGMP levels in Sham and heart failure adult cardiomyocytes. Rats were subjected to aortic banding (HF), or sham-operated (Sham), and 6 weeks later cardiomyocytes were isolated. Cells expressing the indicated biosensor were stimulated with either CNP (300 nM) (A–C) or BNP (300 nM) (D–F), and FRET responses were quantified relative to basal. Data are mean ± SEM from n = 5–13 cells from 5 to 6 animals. *P < 0.05 vs. Sham with identical biosensor (two-way ANOVA with Sidak’s multiple comparison test). †P < 0.005 BNP vs. CNP with identical biosensor in the same group (two-way ANOVA with Sidak’s multiple comparison test). (G–I): basal fluorescence intensity ratio (Dimer2/T-sapphire) in unstimulated cardiomyocytes from Sham and HF rats expressing the indicated biosensor. Data are mean ± SEM from n = 11 to 22 cells from five animals in each group. *P < 0.05 vs. Sham (unpaired t-test). (J–L): Cardiomyocytes from Sham or HF were stimulated with CNP (300 nM) or BNP (300 nM) for 10 min. Cells were lysed, subjected to SDS–PAGE, and blotted against p-Ser16-PLB (J) and PLB (L), p-Ser23/24-TnI (K) or TnI (L) and loading control (vinculin). Blots were quantified relative to loading control (vinculin) and related to non-stimulated cells in Sham. Blots are representative of three to four experiments, and data shown are mean ± SEM from three to four animals. *P < 0.05 vs. control and †P < 0.05 vs. BNP (two-way ANOVA with Tukey’s multiple comparison test).

