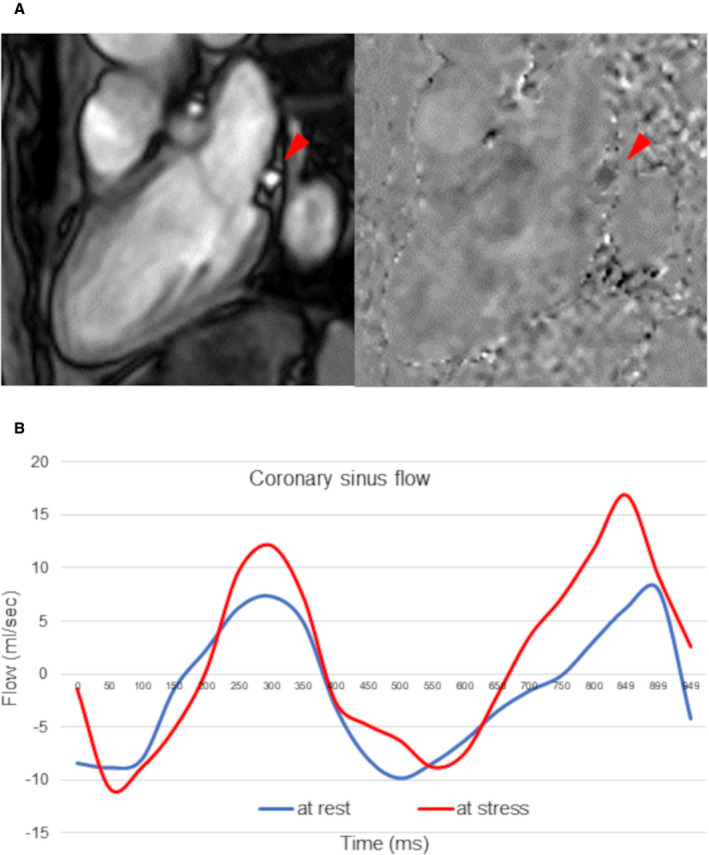
Figure 1. Phase‐contrast cine‐magnetic resonance images of the coronary sinus flow measurement.

A, The proximal coronary sinus was detected in cross‐section on the magnitude and phase‐contrast images. (Red arrows show coronary sinus.) B, The coronary sinus blood flow curves (blue line, resting flow; red line, hyperemic flow) were generated.
