
Figure 1. Sex differences in the natriuretic response to a HS diet challenge in rats.
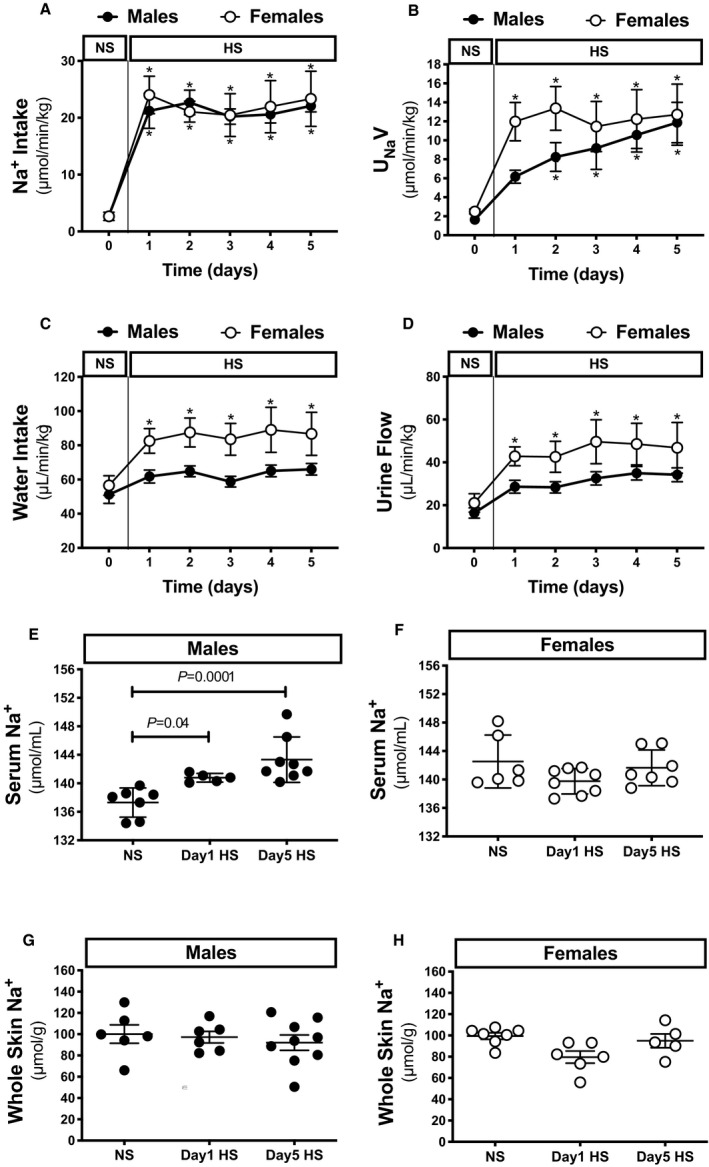
Na+ intake (A), UNaV (B), water intake (C), and urine flow (D) in male and female Sprague Dawley rats during the NS diet phase or the HS challenge. Serum levels of Na+ (E and F) and whole skin Na+ (G and H) relative to dry skin weight in male and female rats during the NS diet phase or on days 1 and 5 of the HS diet challenge (n=5–8 rats in each group). Statistical comparisons were performed by repeated measures 2‐way ANOVA with Sidak’s post hoc test for multiple comparisons (A through D) or two‐way ANOVA with Sidak’s post hoc test for multiple comparisons (E through H). *P<0.05 vs corresponding NS values. ANOVA results: Na+ intake: P interaction=0.9, P time<0.0001, P sex=0.8; UNaV: P interaction=0.5, P time<0.0001, P sex=0.2; water intake: P interaction=0.6, P time=0.002, P sex=0.01; urine flow: P interaction=0.9, P time=0.001, P sex=0.03; serum Na+: P interaction=0.002, P diet=0.02, P sex=0.3; skin Na+: P interaction=0.3, P time=0.2, P sex=0.3. HS indicates high salt; NS, normal salt; and UNaV, urinary excretion of Na+.