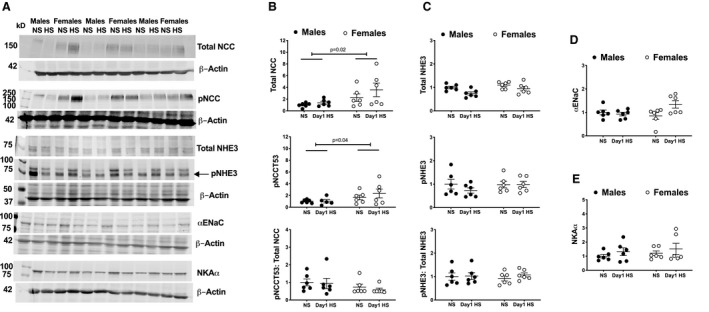
Figure 3. Na+ transporter protein expression during the HS diet challenge.

Representative Western blots of Na+ transporters and loading controls are presented (A). Protein abundance of total NCC, pNCC, and the ratio thereof (B), total NHE3 and pNHE3, and the ratio thereof (C), αENaC (D) and NKAα (E), in renal cortices from male and female Sprague Dawley rats during the NS diet phase or on day 1 of the HS challenge (protein abundance is presented relative to corresponding levels in male NS rats (n=6 rats in each group). Statistical comparisons were performed by 2‐way ANOVA with Sidak’s post hoc test for multiple comparisons. ANOVA results: total NCC: P interaction=0.5, P diet=0.2, P sex=0.02; pNCC: P interaction=0.5, P diet=0.2, P sex=0.04; pNCC: total NCC: P interaction=0.8, P diet=0.6, P sex=0.1; total NHE3: P interaction=0.4, P diet=0.01, P sex=0.04; pNHE3: P interaction=0.4, P diet=0.4, P sex=0.4; pNHE3: total NHE3: P interaction=0.6, P diet=0.5, P sex=0.9; αENaC: P interaction=0.04, P diet=0.1, P sex=0.3; NKAα: P interaction=0.9, P diet=0.2, P sex=0.4. αENaC indicates epithelial Na+ channel α subunit HS, high salt; NCC, Na+/Cl− cotransporter; NHE3, Na+/H+ exchanger isoform 3; NKAα, Na+, K+‐ATPase α; NS: normal salt; pNCC, phosphorylated Na+/Cl− cotransporter; and pNHE3, phosphorylated Na+/H+ exchanger isoform 3.
