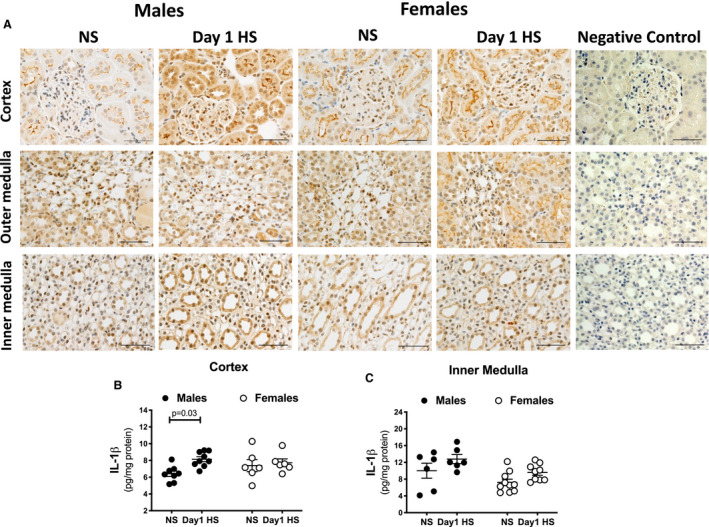
Figure 6. Renal cortical interleukin‐1β expression during the HS diet challenge.

Representative images of IL‐1β protein expression in the renal cortex and outer and inner medulla of male and female Sprague Dawley rats during the NS diet phase or on day 1 of the HS challenge (n=5–6 rats in each group; scale bar, 20 μm). Negative control images are represented (A). Protein levels of IL‐1β measured by ELISA in renal cortex (B) and inner medulla (C) of male and female Sprague Dawley rats during the NS diet phase or on day 1 of the HS challenge (n=6–10 rats in each group). Brown color corresponds to IL‐1β‐positive staining. Statistical comparisons were performed by two‐way ANOVA with Sidak’s post hoc test for multiple comparisons. ANOVA results: cortex: P interaction=0.1, P diet=0.03, P sex=0.5; inner medulla: P interaction=0.8, P diet=0.02, P sex=0.008. HS indicates high salt; IL, interleukin; and NS, normal salt.
