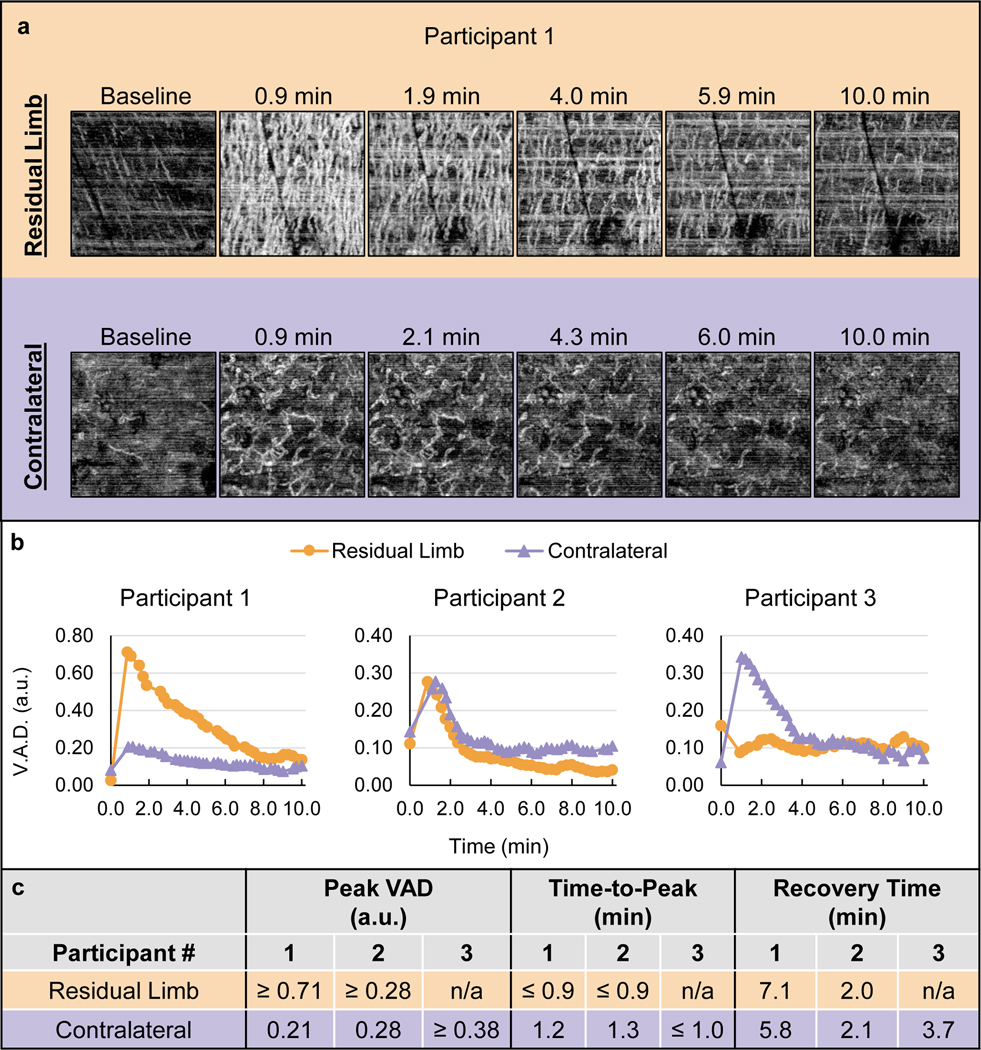
Figure 2.
RH Test results. (a) Representative image set showing select en face OCT images from the RH tests on each limb of Participant 1. Images are 2 × 2 mm. Horizontal white lines are motion artifacts. (b) Plots of VAD vs. time for each participant. (c) Quantified vascular response characteristics determined by the VAD vs. time data.

