
Figure 3:
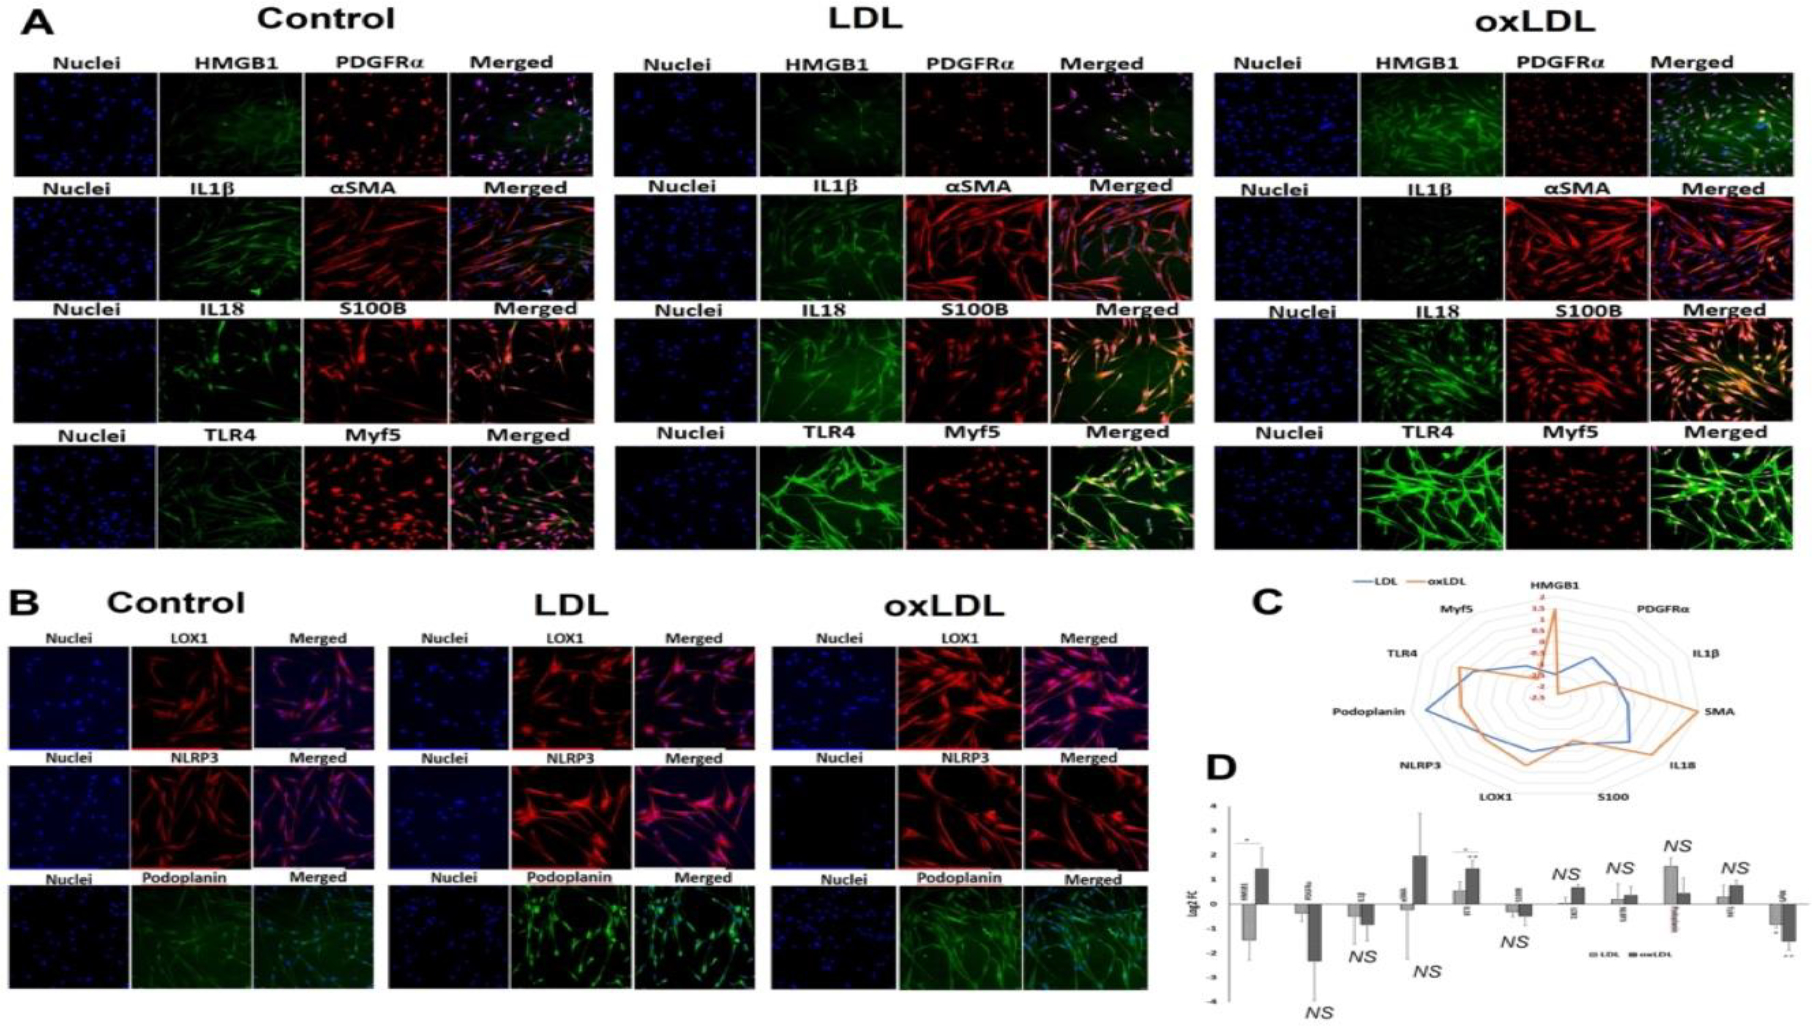
Representative images for the (A) immuno-double staining on the carotid SMCs for the expression of IL18 and S100B, PDGFRα and HMGB1, αSMA and IL1β, and TLR4, and Myf5 showing the altered expression in the LDL and oxLDL treatment group vessels, and (B) immunostaining on the carotid vessels for the expression of LOX1, NLRP3, and podoplanin showing the altered expression in the LD and oxLDL treatment group vessels. Images in the left panel represent the control group, middle panel represent the LDL treatment group and at the right panel represent oxLDL treatment group. Images in the left column of each panel show nuclear staining with DAPI; the images in the middle column/s show expression of proteins while the images in the right column show overlay staining with DAPI. Images were acquired at 20x magnification. (C) Radar plot showing the extent of protein expression mostly favoring oxLDL treatment. (D) The quantification of gene expression expressed as Log2 FC where the graph represents mean values with standard error. The statistical significance based on one-way ANOVA test is represented in the figure (line indicates comparison between LDL and oxLDL groups, * P<0.05, ** P<0.01, and NS - non-significant).