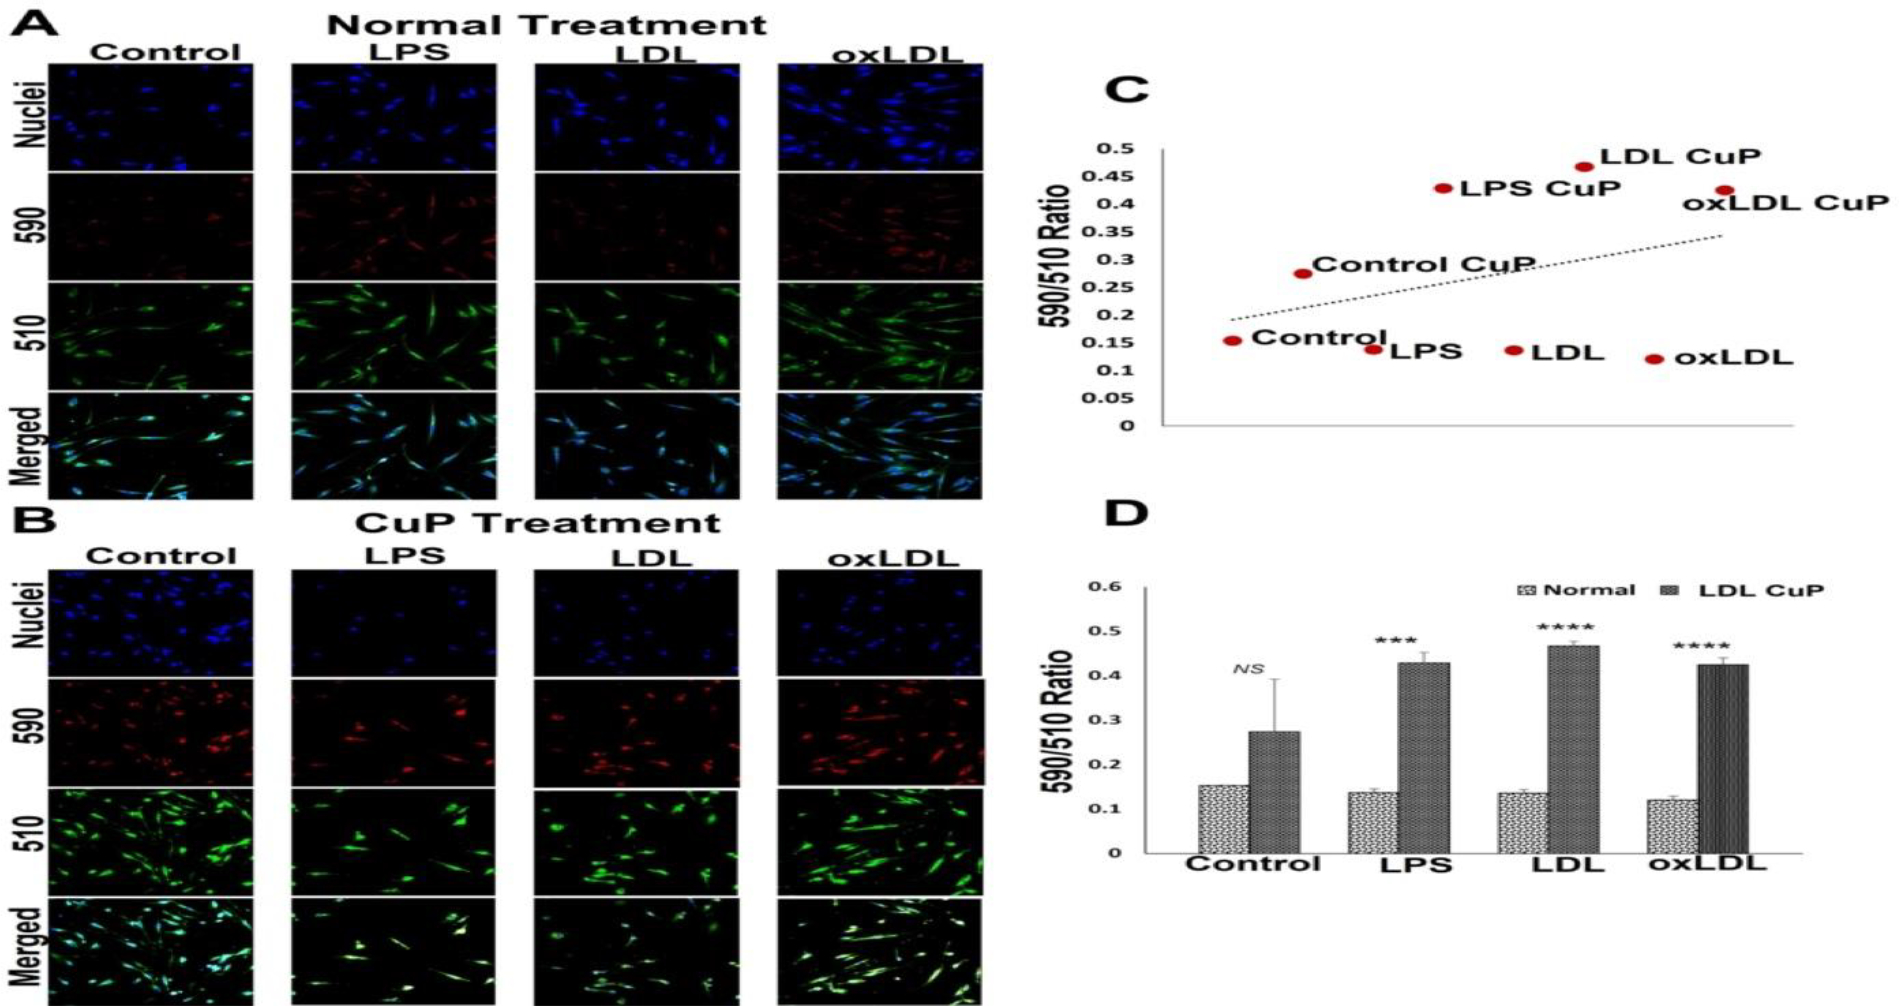
Figure 4:

Representative images for the lipid peroxidation staining: (A) carotid SMCs treated with LPS, LDL and oxLDL and (B) carotid SMCs treated with LPS, LDL and oxLDL along with CuP. Images in the left panel represent the control group, second panel represents LPS group, third panel represent the LDL treatment group and at the right panel represent oxLDL treatment group. Images in the top row of each panel show nuclear staining with DAPI; the images in the middle rows show intensities at 590 and 510 and the lower row shows overlay staining with DAPI. Images were acquired at 20x magnification. (C) Scatter plot showing the trend of decreased lipid peroxidation in CuP treatment group. (D) The quantification of lipid peroxidation based on 590/510 ratio where the graph represents mean values with standard error. The statistical significance based on one-way ANOVA test is represented in the figure (*** P<0.001, **** P<0.0001, and NS - non-significant).
