
Figure 6:
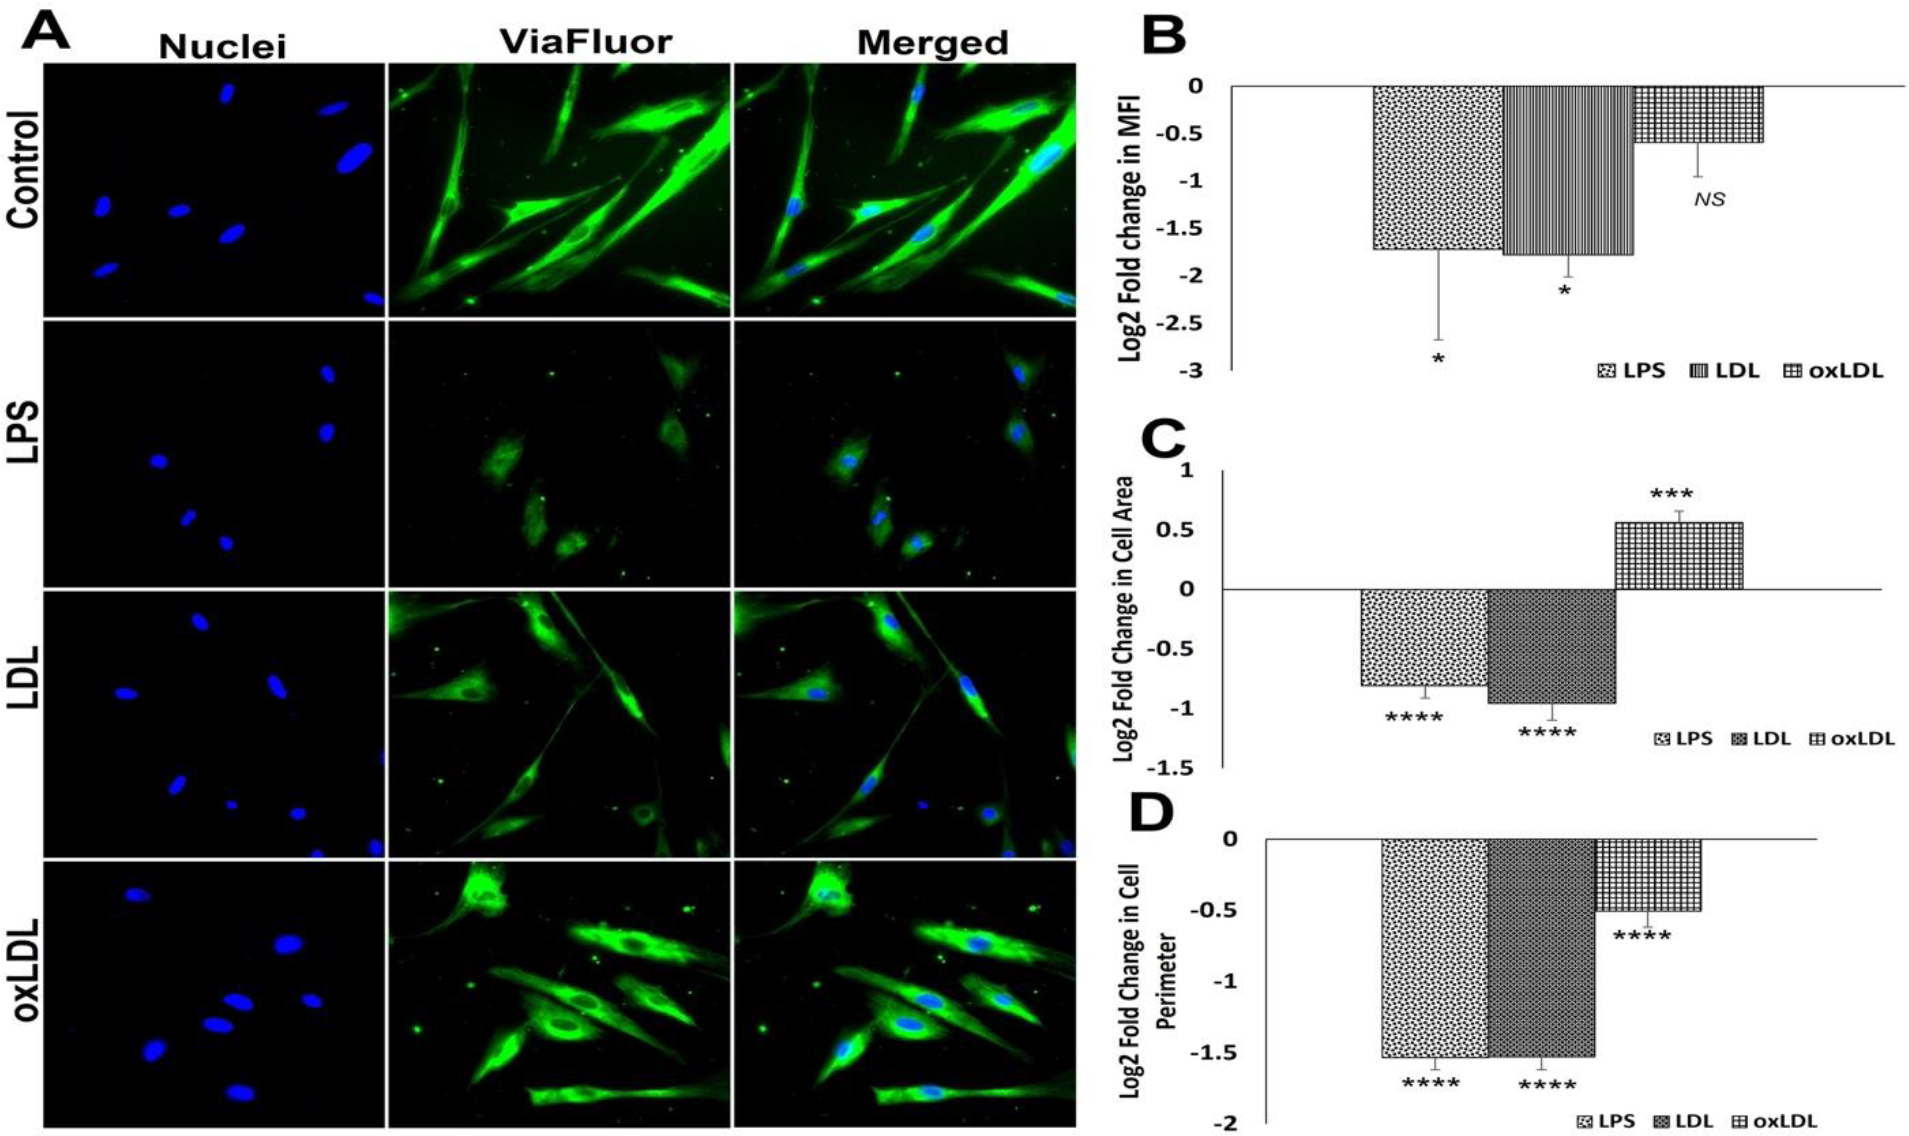
Microtubule staining by Viafluor: (A) Representative images for Viafluor staining showing control SMCs and carotid SMCs treated with LPS, LDL and oxLDL. Images in the left panel represent the nuclei, middle panel represents Viafluor staining, and the right panel shows overlay staining with DAPI. (B) The quantification of Viafluor staining where the graph represents mean values with standard error. The quantification of area (C) and perimeter (D) from the Viafluor stained images. The statistical significance based on one-way ANOVA test is represented in the figure (**** P<0.0001, *** P<0.001, * P<0.05, and NS - ).