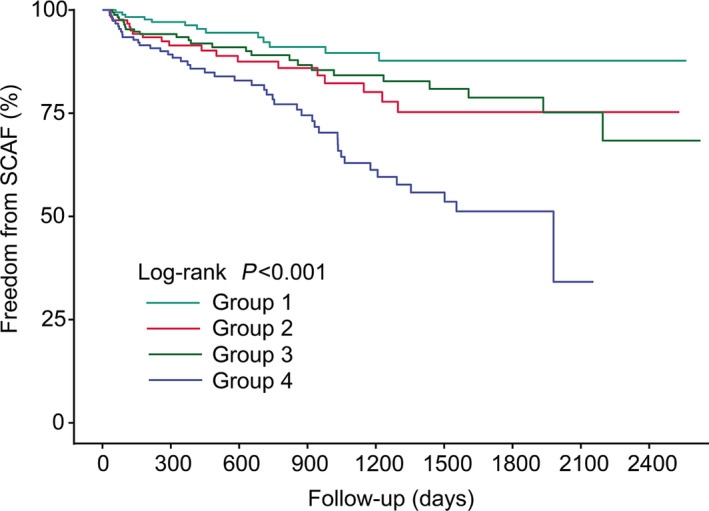
Figure 6. Kaplan‐Meier curve showing the incidence of SCAF.

All patients were divided into 4 categories. From top to bottom, the lines represent the following: group 1: patients with both low‐level homocysteine and UA (turquoise); group 2: patients with high‐level UA and low‐level homocysteine (red); group 3: patients with high‐level homocysteine and low‐level of UA (green); group 4: patients with high levels of both Hcy and UA (blue). Hcy indicates homocysteine; SCAF, subclinical atrial fibrillation; and UA, uric acid.
