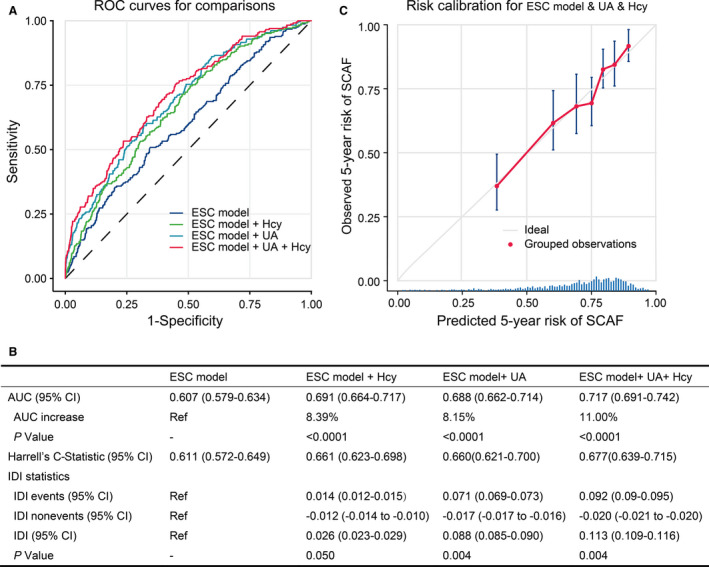
Figure 7. Model‐comparison results of predicting the 5‐year incidence of SCAF.

A, Receiver operating characteristics (ROC) curves of freedom from SCAF at 5 years for the different risk prediction models. B, Comparison of the area under the curve (AUC), Harrel’s C‐statistic, the integrated discrimination improvement (IDI) statistics, and 95% CIs in the different risk prediction models. C, Validation of the final model (ESC model+UA+homocysteine) showing observed incidences of SCAF within 5 years. The diagonal gray line represents a situation of perfect prediction when the observed incidences would be identical to the predicted baseline risks. Points are drawn to represent the averages in 7 discretized bins, and error bars are 95% CIs for the proportion of events in each group. The rug under the plot illustrates the distribution of predictions. ESC indicates European Society of Cardiology; Hcy, homocysteine; SCAF, subclinical atrial fibrillation; and UA, uric acid.
