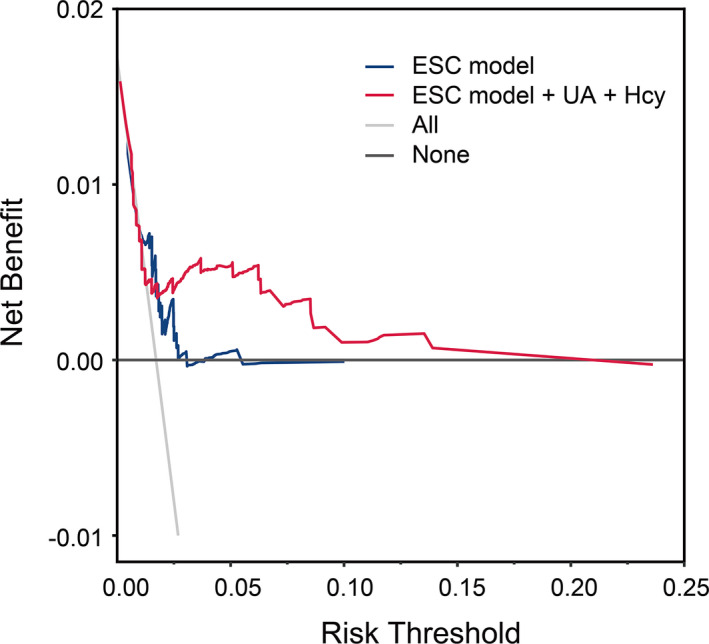
Figure 8. Decision curve analyses (DCA) of the ESC model and final model for 5‐year SCAF incidence.

The x axis indicates the threshold incidence for SCAF at 5 years, and the y axis indicates the net benefit. The horizontal dark gray line: to assume no patients will experience the event; the light gray line: to assume all patients will experience the event. The ESC final model had enhanced net benefit compared with the ESC model at risk threshold >2.5%. ESC indicates European Society of Cardiology; Hcy, homocysteine; SCAF, subclinical atrial fibrillation; and UA, uric acid.
