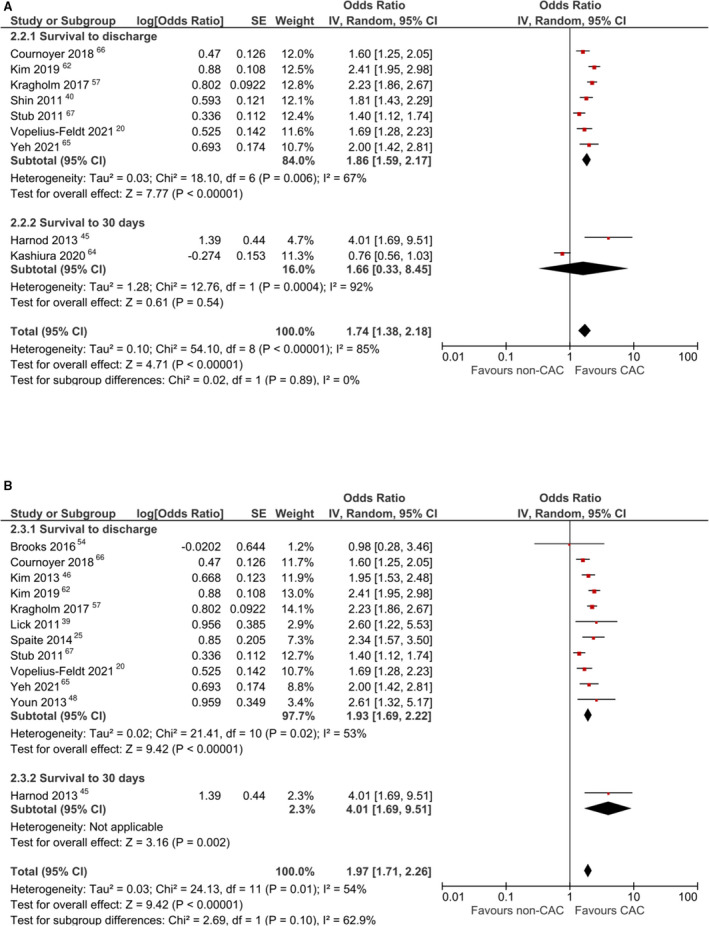
Figure 6. Sensitivity analyses for survival using less strict definitions of cardiac arrest centers (CACs).

A, Forest plot for meta‐analysis of adjusted analyses comparing survival between CACs and non‐CACs using a random‐effects model and including high‐volume centers. B, Forest plot for meta‐analysis of adjusted analyses comparing survival between CACs and non‐CACs using a random‐effects model and including improved‐care centers. IV indicates inverse variance.
