
Figure 2. Relative changes in pial arteriolar diameter, red blood cell (RBC) velocity, and RBC flux per arteriole compared with baseline (Δ%) as a function of cerebral perfusion pressure (CPP; mm Hg).
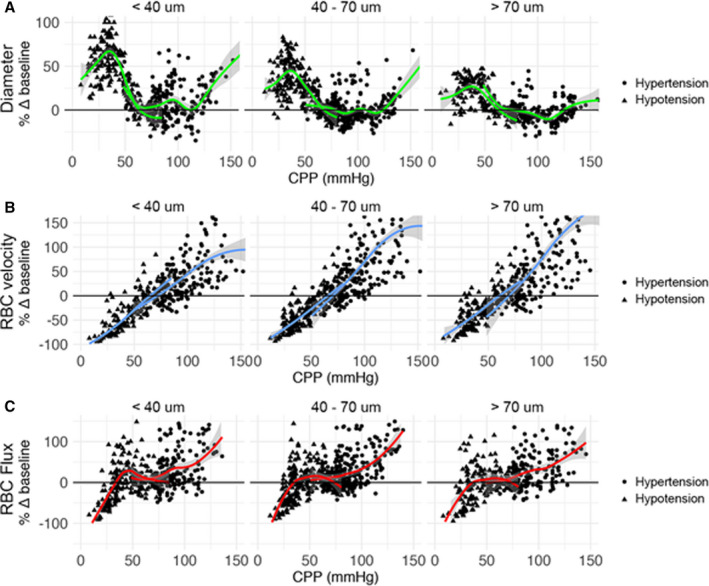
Individual data points are shown (triangle=hypotension experiment, and circle=hypertension experiment). Plots are stratified according to arteriolar size category to demonstrate the differential role of baseline arteriolar caliber. A generalized additive model smoothing function is applied separately on 2 sets of experiments (hypotension and hypertension) to visualize trends. A, Pial arteriolar diameter. B, RBC velocity. C, RBC flux.