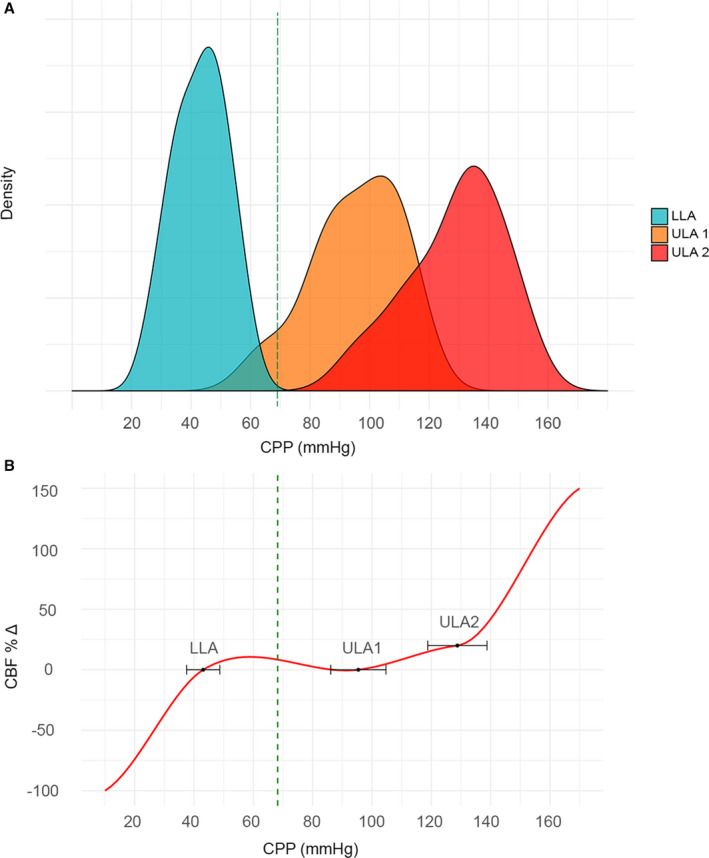
Figure 6. Intersubject variability in the limits of cerebrovascular autoregulation (CA).

A, Density plot demonstrating the distribution of intersubject limits of CA (cerebral perfusion pressure [CPP]; in mm Hg): lower limit of autoregulation (LLA), upper limit of autoregulation (ULA) 1, and ULA2. Mean baseline CPP of 68.2 mm Hg is indicated by a green dashed vertical line. B, Illustration of the CPP–cerebral blood flow (CBF) relationship (red curve), demonstrating intersubject variability in the limits of CA (CPP in mm Hg). Black dots and horizontal error bars indicate mean LLA of 43.1 mm Hg (95% CI, 37.5–48.7 mm Hg), ULA1 of 95.4 mm Hg (95% CI, 86.1–104.7 mm Hg), and ULA2 of 128.8 mm Hg (95% CI, 118.8–138.8 mm Hg).
