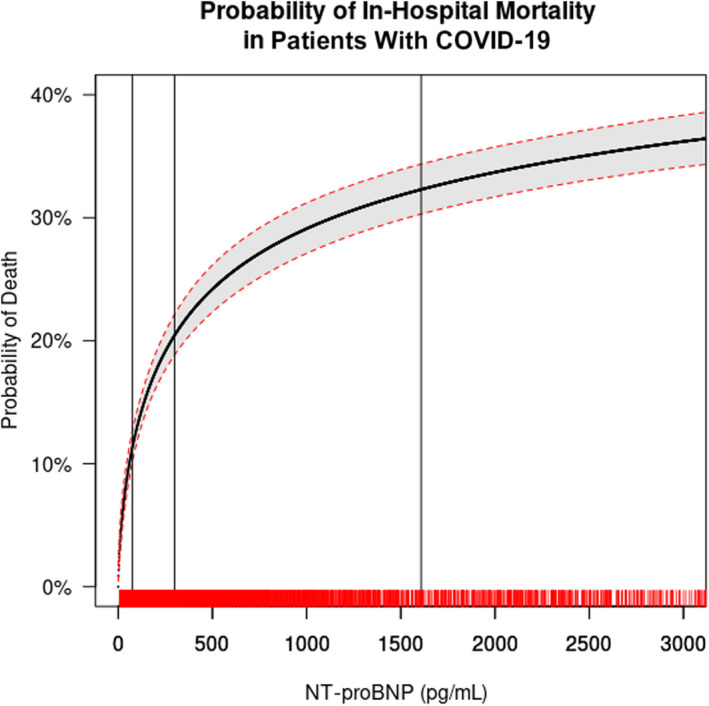
Figure 1. Probability of death by continuous baseline NT‐proBNP. Restricted cubic spline modeling for the probability of in‐hospital mortality across varying levels of NT‐proBNP admission value.

The solid black line indicating probability and the shaded area representing 95% CI. The vertical lines indicate the interquartile (IQR: 25th=74.55 pg/mL, 50th=299.0 pg/mL, and 75th=1608.0 pg/mL) of NT‐proBNP values. The C‐statistic for the model was 0.704, knots located at 200, 600 and 1000 pg/mL with logarithmic smoothing of the curve. A rug plot on the x axis displays the density of the data. The presentation of the x axis was restricted to NT‐proBNP values <3000 pg/mL to display the highest density of data and increased in probability of death. NT‐proBNP indicates N‐terminal pro‐B‐type natriuretic peptide.
