
Figure 7. Intensity‐weighted polar histogram.
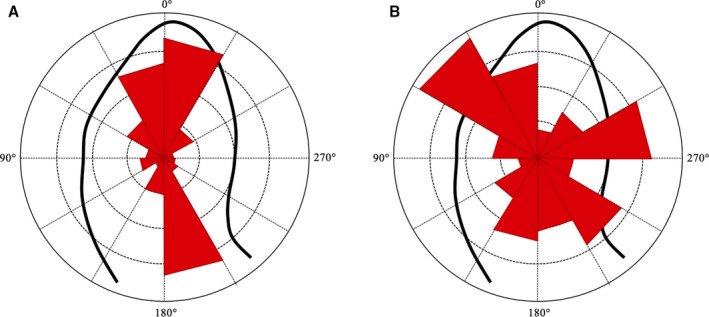
The distribution and intensity of the left ventricular hemodynamic forces during the entire heartbeat are shown by red isosceles triangles within a polar histogram. A, Patient with a mainly longitudinal (apex‐base) directed forces; (B) Patient with a prevalent transversal (septal‐lateral or inferior‐anterior) directed forces.