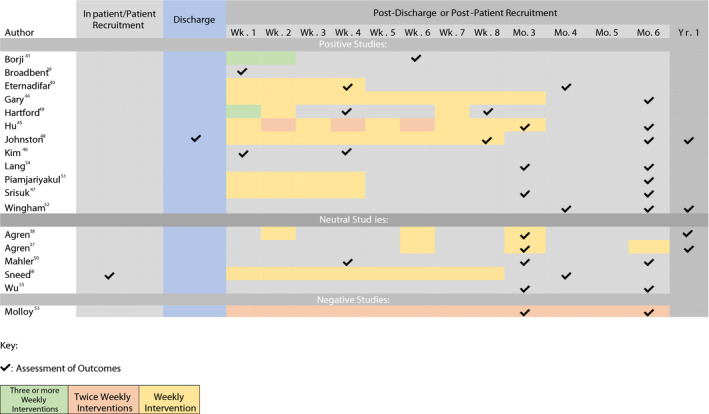
Figure 2. Temporal Gannt chart characterizing timing of implementation of interventions for caregivers, and points at which caregiver outcomes were assessed.

Studies are listed based on overall caregiver outcomes: positive outcomes, neutral or no change studies, and negative or adverse effect studies. Number of interventions per week (ie, once a week, twice a week, or ≥3 times a week) is color‐coded. Time points at which patients are assessed for outcomes, for instance, by phone call or electronic survey, is marked with check marks.
