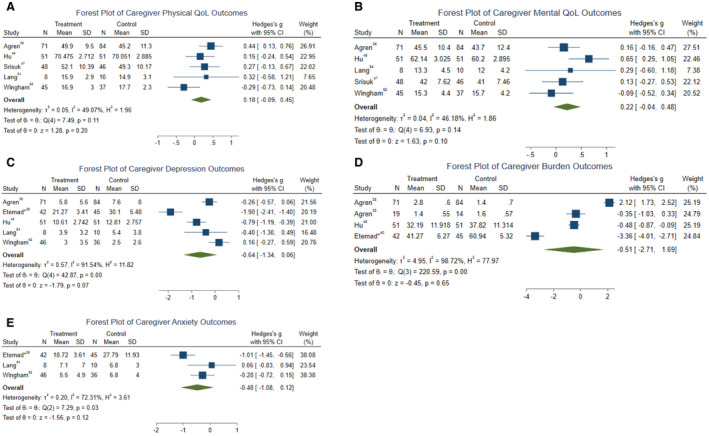
Figure 3. Forest plots representing effect size (Hedges’ g) distribution for the outcomes.

A, Physical quality of life (Hedges’ g=0.178; 95% CI, −0.09 to 0.45). B, Mental quality of life (Hedges’ g=0.22; 95% CI, −0.04 to 0.48). C, Depression (Hedges’ g=−0.64; 95% CI, −1.34 to 0.06). D, Burden (Hedges’ g=−0.51; 95% CI, −2.71 to 1.70). E, Anxiety (Hedges’ g=−0.48; 95% CI, −1.08 to 0.12).
