
Figure 3. Left, Scatterplot with regression line for cardiac output (CO), measured by the scale and direct Fick method (64 data pairs; r=0.85); Right, Bland‐Altman analysis with mean error (bias) of −0.31 mL, 95% limits of agreement (LOA) of −2.62 to 2.00 L/min, and percentage error (PE) of 41.18%.
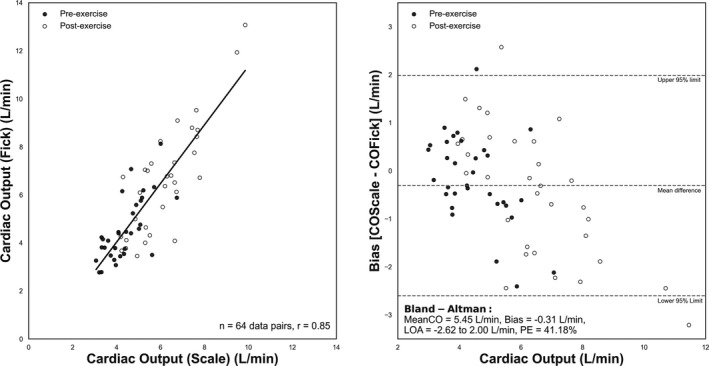
Preexercise data denoted with a black circle, and postexercise data denoted with a white circle. MeanCO indicates mean CO for combined scale and Fick measurements.