
Figure 4. Concordance plot.
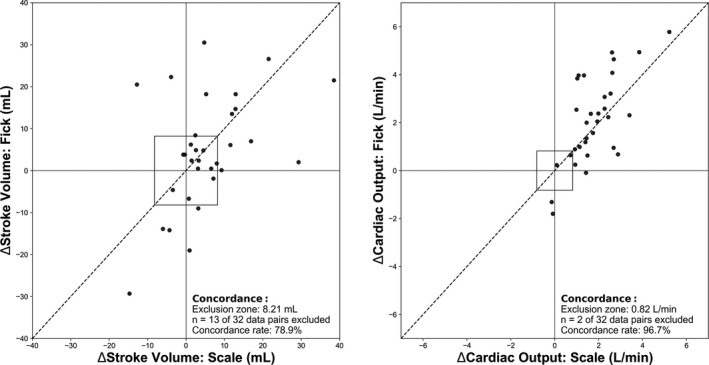
Left: Change in stroke volume postexercise minus preexercise from the scale vs the direct Fick method. Right: Similar plot for cardiac output. A central exclusion zone (square) represents the data within 15% of the mean stroke volume or cardiac output in the study, as they contain a high level of random variation compared with changes in the cardiac output. The line of identity y=x is shown.