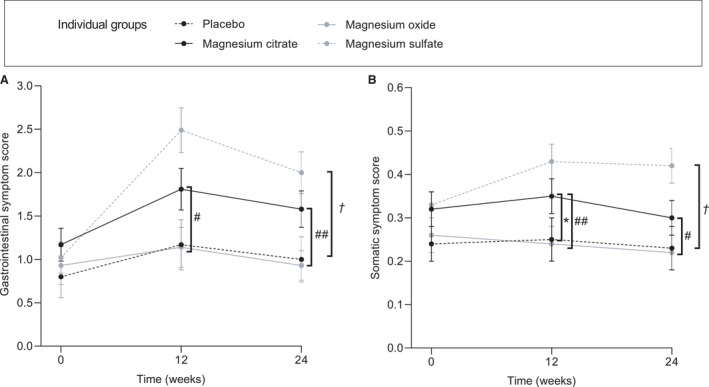
Figure 3. Gastrointestinal symptom scores (A) and somatic symptom scores (B).

Scores represent mean±SEM. For the somatic symptom score, the mean of the 14 items was calculated. For the composite gastrointestinal score, the items “Stomach pain”, “constipation, loose bowels, or diarrhea,” and “nausea, gas, or indigestion” were summed up. Between‐group differences were calculated with the Mann‐Whitney U test. *P<0.05 magnesium citrate vs placebo, † P<0.05 magnesium sulfate vs placebo, # P<0.05 magnesium oxide vs magnesium citrate, ## P<0.01 magnesium vs magnesium citrate.
