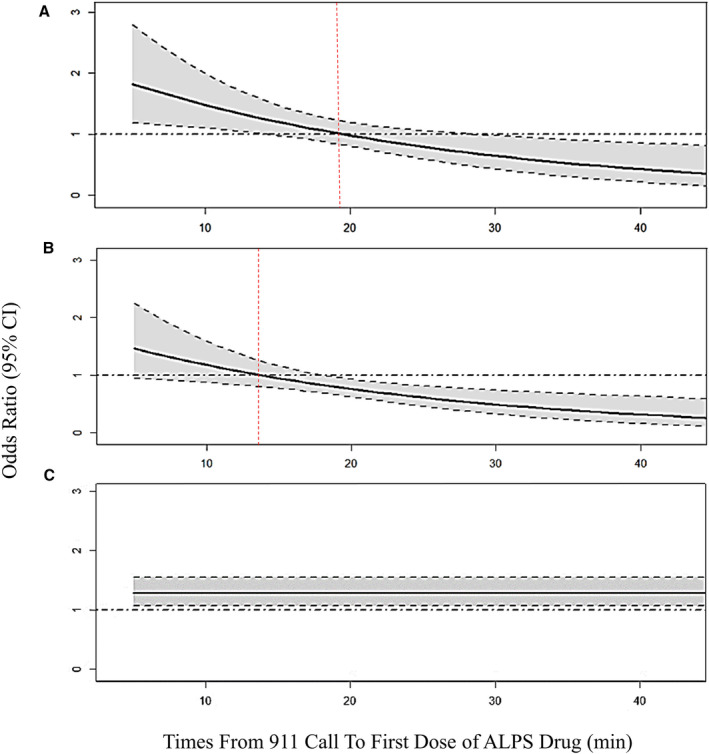
Figure 2. Change in odds ratio (OR) of return of spontaneous circulation (ROSC) at hospital arrival (solid black line) based on time to the first dose of (A) amiodarone (vs placebo).

(B) Amiodarone (vs lidocaine). (C) Lidocaine (vs placebo). Black dashed line indicates OR=1; Red dashed line indicates time when OR of ROSC crosses 1; Shaded area shows 95% CI. ALPS indicates Amiodarone Lidocaine Placebo Study; OR, odds ratio; and ROSC, return of spontaneous circulation.
