
Figure 2. Survival curves categorized by T1, T2, and ECV.
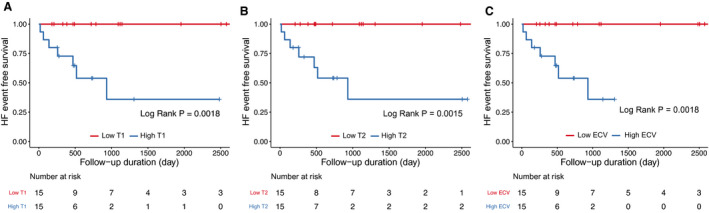
The survival curves the events according to native T1 mapping value (A) (high vs low, cut‐off value: 1308 ms, as a median value), T2 mapping values (B) (high vs low, cut‐off value: 52.5 ms, as a median value), and extracellular volume (ECV) fraction (C) (high vs low, cut‐off value: 30.2%, as a median value). HF indicates heart failure.