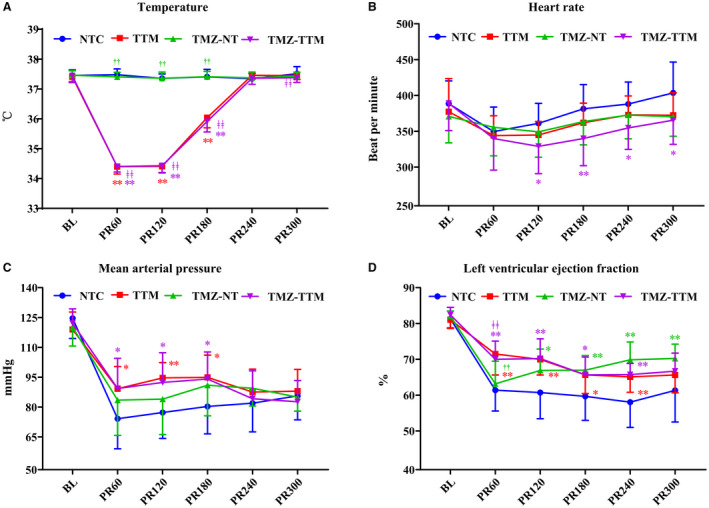
Figure 2. Esophageal temperature and hemodynamic data (n=15/group). Temperature (A), heart rate (B), mean arterial pressure (C), and left ventricular ejection fraction (D) were measured at baseline (BL) and postresuscitation.

NTC indicates normothermia control; TMZ‐NT, trimetazidine‐normothermia; TMZ‐TTM, trimetazidine‐targeted temperature management; and TTM, targeted temperature management. * and ** P<0.05 and P<0.01 compared with NTC; †† P<0.01 compared with TTM; ‡‡ P<0.01 compared with TMZ‐NT. n=15 at each time point except for n=14 from postresuscitation 120 to postresuscitation 360 in the NTC group.
