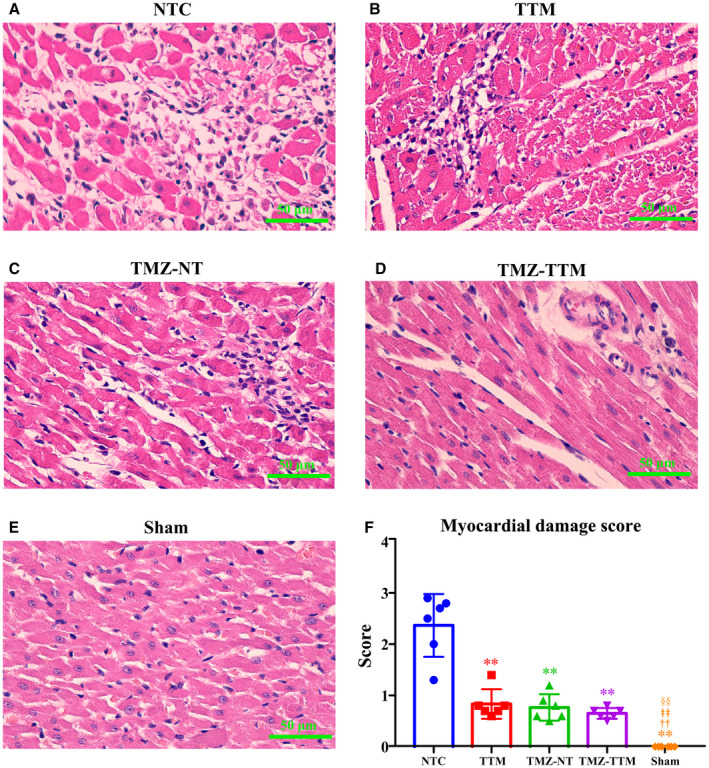
Figure 4. Hematoxylin and eosin staining of myocardial tissue (n=6/group). Representative micrographs of the hematoxylin and eosin‐stained myocardial tissue at 96 hours after resuscitation in each group (A through E) (10 quantified fields/animal) and the myocardial damage score (F).

NTC indicates normothermia control; Sham, sham‐operated; TMZ‐NT, trimetazidine‐normothermia; TMZ‐TTM, trimetazidine‐targeted temperature management; and TTM, targeted temperature management. ** P<0.01 compared with NTC; †† P<0.01 compared with TTM; ǂǂ P<0.01 compared with TMZ‐NT; §§ P<0.01 compared with TMZ‐TTM.
