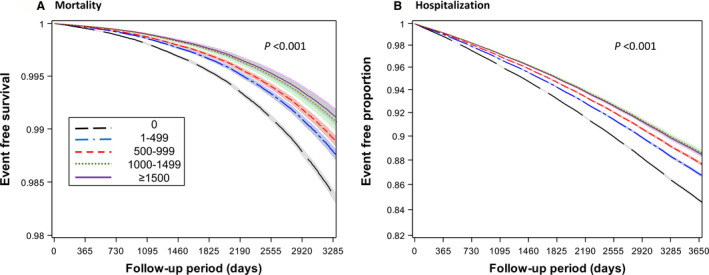
Figure 1. Survival plots for lower respiratory tract infection outcomes by the amount of physical activity among individuals with cardiovascular diseases.

The amount of physical activity was categorized into 5 groups (0, 1–499, 500–999, 1000–1499, and ≥1500 metabolic equivalents of task min/wk). To create the survival plots for lower respiratory tract infection mortality; (A) and lower respiratory tract infection hospitalization (B), multivariate‐adjusted Cox regression was used (adjusting for age at baseline, sex, smoking status, alcohol consumption frequency, household income, blood pressure status, fasting glucose status, body mass index, prevalent chronic obstructive pulmonary disease, and history of admission attributable to lower respiratory tract infection).
