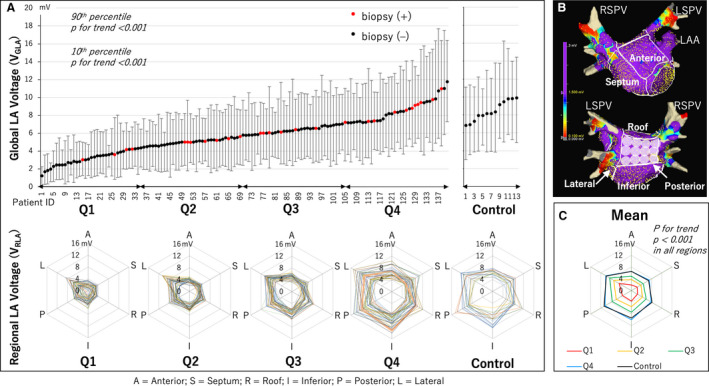
Figure 1. Distribution of global and regional LA voltage.

A, Distribution of the global LA voltage (VGLA) ordered from lowest to highest in the AF group and the control group. The range bar corresponds to 10th and 90th percentiles of voltage of each patient. Q1 to Q4 show quartiles of the AF group based on VGLA. Red dot shows a patient with atrial biopsy, while black dot shows a patient without biopsy. The radar charts show the mean voltage value of the 6 anatomical regions of the LA (VRLA) (A, anterior; S, septum; R, roof; I, inferior; P, posterior; L, lateral) for all patients in each quartile and the control group. B, LA was divided into the 6 anatomical regions to calculate each VRLA. The white tags on the posterior wall were 1 cm in diameter. The maximum voltage in each 1 cm2 area was selected with reference to these tags, and the VGLA and VRLA at each anatomical region were calculated as the mean of these values. C, The radar chart shows the mean VRLA for each quartile and the control group. VRLA decreased in all regions as the quartile moved down. The VRLA of Q4 and the control was similar in all regions. AF indicates atrial fibrillation; LA, left atrium; LAA, left atrial appendage; LSPV, left superior pulmonary vein; and RSPV, right superior pulmonary vein.
