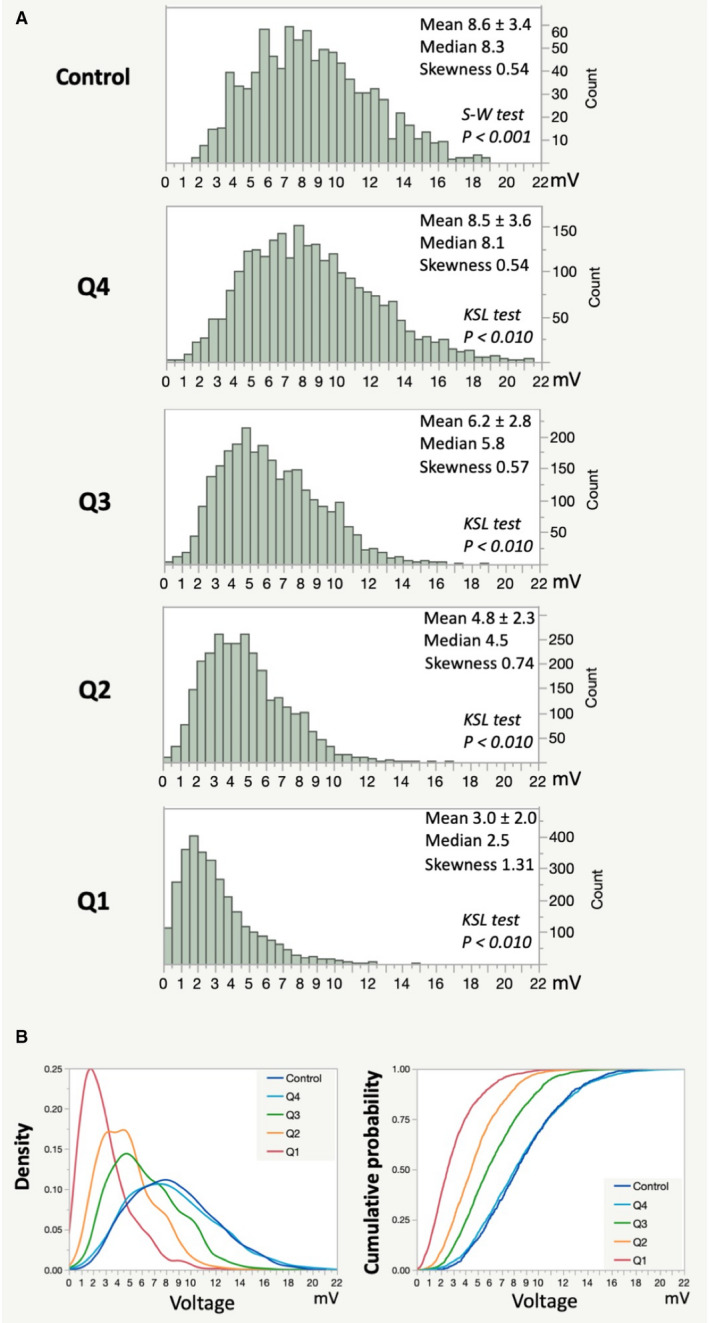
Figure 2. Distribution of bipolar voltage values in all patients in each quartile and the control group.

A, Histograms of all bipolar voltage values in all patients in each quartile and the control group are shown. Each histogram consisted of a total of 2999 (Q1), 2832 (Q2), 2645 (Q3), 2492 (Q4), and 931 (control) voltage values. B, A density curve and cumulative probability curve of each quartile and the control group are shown. KSL indicates Kolmogorov‐Smirnov Lillefors; and S‐W, Shapiro‐Wilk.
