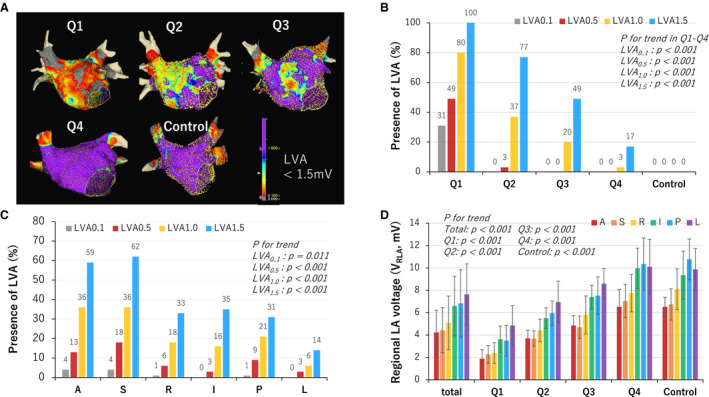
Figure 3. Presence of LVA and regional LA voltage in each quartile and the control group.

A, Examples of voltage map of each quartile and the control group. LVA was defined as <1.5 mV. The color gradation indicates the serial changes in the voltage amplitude from purple at 1.5 mV to grey at 0.1 mV as shown in the color bar at the lower right in the panel. B, The presence of LVA by quartile and in the control group at different voltage cutoffs, which increased as the quartile moved down at any voltage cutoff, and as the voltage cutoff increased. No LVAs were identified in the control group even with a voltage cutoff of 1.5 mV. C, The presence of LVA by region decreased in the order of anterior, septum, roof, inferior, posterior, and lateral at any voltage cutoff. D, Regional LA voltage (VRLA) increased in the same order at any quartile, and the same trend was observed in the control group. LA indicates left atrium; and LVA, low‐voltage area.
