
Figure 5. Right atrial septum biopsy.
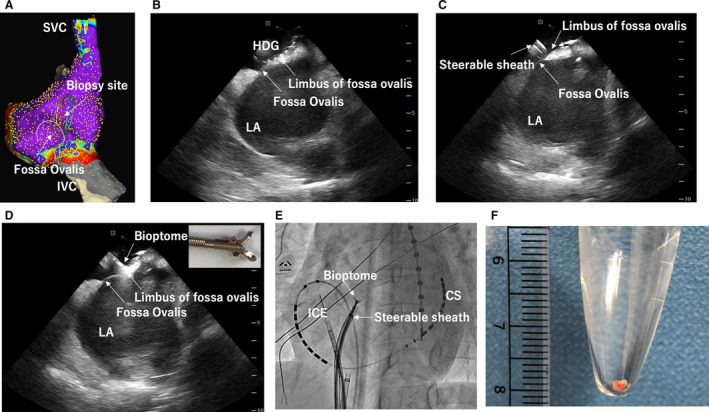
A, An example of voltage map of the RA septum with a shadow of GMC showing the biopsy site. B, An image of intracardiac echocardiography (ICE) showing that GMC was placed at the limbus of the fossa ovalis. C, An image of ICE showing a steerable sheath placed near the biopsy site on the limbus of the fossa ovalis. D, An image of ICE showing a bioptome directly advanced to the biopsy site through the steerable sheath. E, Fluoroscopy viewed from left anterior oblique showing the location of the ICE, steerable sheath, and bioptome. F, An example of biopsy sample with 2 mm size. CS indicates coronary sinus; IVC, inferior vena cava; LA, left atrium; RA, right atrium; and SVC, superior vena cava.