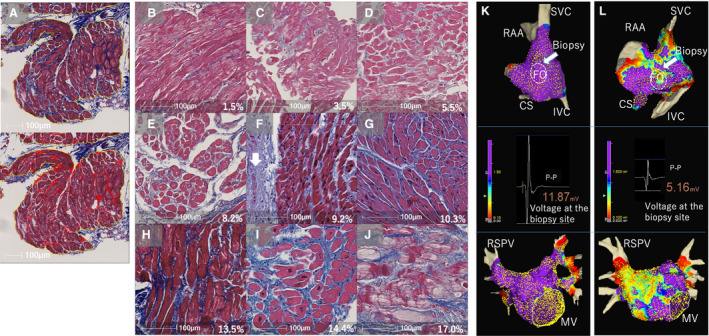
Figure 6. Histological assessment of atrial biopsy samples.

A, A Masson's trichrome stained sample from the right atrial (RA) septum (top) and the algorithm for quantitative analysis of %fibrosis using the image analysis platform (HALO) (bottom). The blue staining in the top indicates fibrosis. Only the area surrounded by the yellow lines, which excludes the endocardial connective tissue and adipose tissue, was analyzed to measure %fibrosis. The blue stained areas were highlighted in red and %fibrosis was calculated by dividing the total red area by the total area surrounded by the yellow line. B through J are examples of histological images ordered from low to high %fibrosis. Endocardium (white arrow in F) and large adipose tissue were excluded from the measurement of %fibrosis. The value in each figure shows %fibrosis. K, The voltage map of the RA septum (top) and LA (bottom) of the same patient as in (B). There is no LVA (defined as <1.5 mV) and the bipolar voltage at the biopsy site is high (middle). L, The voltage map of the RA septum and LA of the same patient as in (I). LVAs were identified and the bipolar voltage at the biopsy site was relatively low. The color gradation indicates the serial changes in the voltage amplitude from purple at 1.5 mV to grey at 0.1 mV. CS indicates coronary sinus; f, %fibrosis; FO, fossa ovalis; IVC, inferior vena cava; LVA, low‐voltage area; MV, mitral valve; RAA, right atrial appendage; RSPV, right superior pulmonary vein; and SVC, superior vena cava.
