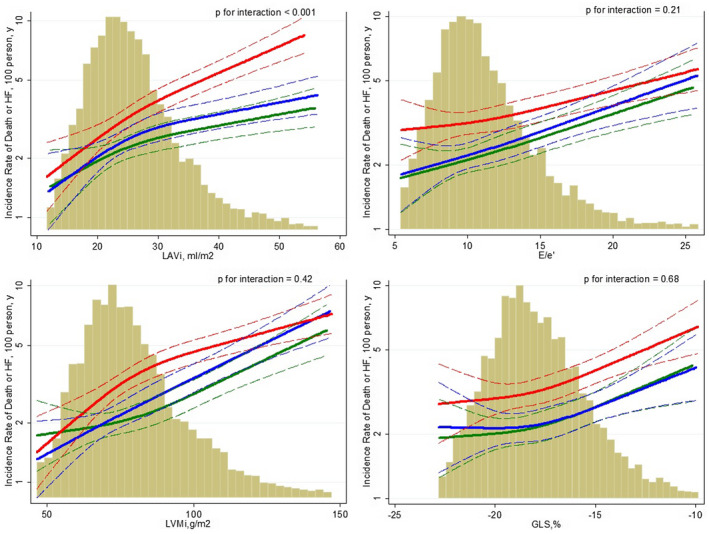
Figure 2. Adjusted association of LAVi, GLS, LVMi and E/e′ and death or HF stratified by glycemic groups (Red: diabetes; Blue: Pre‐diabetes; Green: No‐diabetes).

Multivariable adjustment: sex, race/center, log‐total cholesterol, log‐LDL, statins medication, history of hypertension, systolic blood pressure, heart rate, QRS interval, estimated glomerular filtration rate, body mass index, smoking status, history of coronary artery disease, prevalent HF, heart valve disease, and history of implantable cardiac defibrillator/pacemaker, stratified by age and history of coronary artery disease. The histograms on the background show the population distribution of the cardiac measure analyzed. The dashed lines indicate the 95% CIs for the reported incidence rate. GLS indicates global longitudinal strain; LAVi, left atrial volume index; and LVMi, left ventricular mass index.
