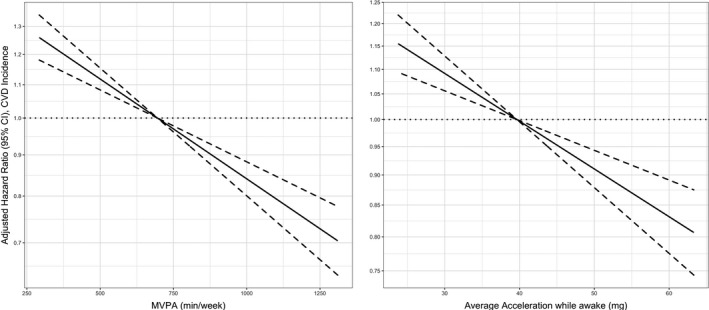
Figure 4. Dose‐response association (adjusted hazard ratios [HRs] and associated 95% CI band) between accelerometer‐measured moderate‐to‐vigorous physical activity (MVPA) and total volume of physical activity with incidence of cardiovascular disease (CVD) (n=31 968; events=4933).

.Models adjusted for age, sex, education, sedentary behavior (only models for MVPA), sleep pattern, obesity, smoking, and alcohol use. Dose‐response associations were assessed with restricted cubic splines with knots at 10th, 50th, and 90th centiles of the distribution of the exposure of interest (reference category=695.52 min/wk of MVPA; and 39.65 milligravities [mg] for total volume of physical activity). HRs are in logarithmic scale. Dashed line (the line that goes along y=1) represents the reference value. Solid line is the estimate (hazard ratio) and dotted lines is the 95% CI.
