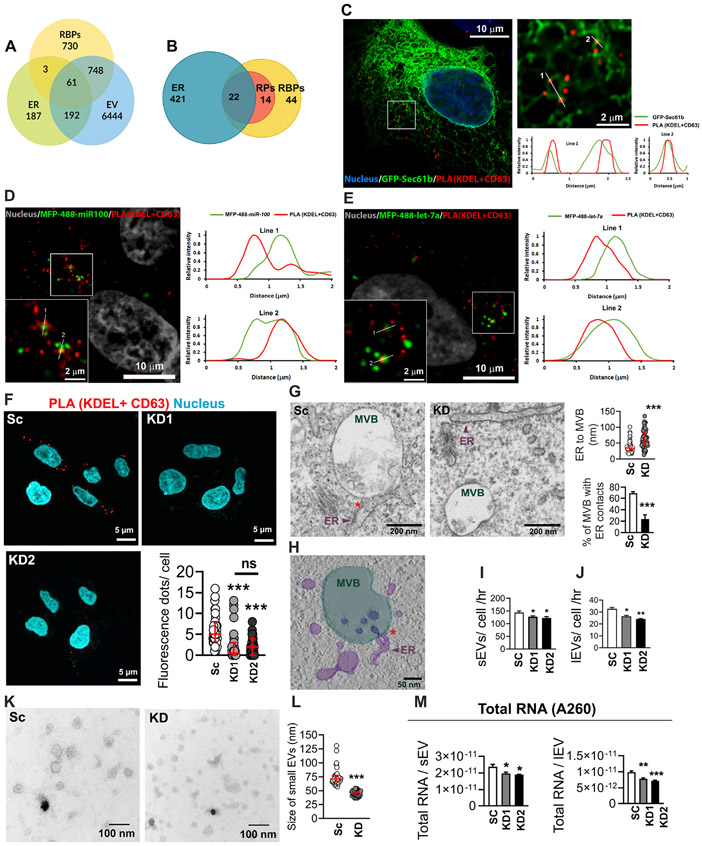
Figure 1: VAP-A regulates ER-MVB contact sites and EV characteristics.
(A) Venn diagram shows the overlap of human RBPs (1542) (Hentze et al., 2018), endoplasmic reticulum (ER) proteins (443) (Thul et al., 2017), and extracellular vesicle (EV) proteins (7445) (from Vesiclepedia (Kalra et al., 2012; Pathan et al., 2019)).
(B) Representation of previously published top 80 EV associated RBPs (Mateescu et al., 2017) present on ER membranes (Thul et al., 2017). Venn diagram shows 22 RBPs (28%) are ER associated and an additional 14 RBPs (18%) are ribosomal proteins (RPs).
(C) Representative merged image for proximity ligation assay (PLA) analysis for ER MCS in GFP-Sec61b-expressing DKs-8 cell. PLA reaction was performed with KDEL (ER marker) and CD63 (late endosome/MVB marker) and appears as red fluorescent dots. DAPI (blue) was used to stain the nuclei. The selected area is enlarged at the right side. Numbered lines were scanned for the intensity of each fluorescence channel of the image and plotted at the right side.
(D and E) Representative merged images for PLA analysis of ER MCS in MFP488-miR100 (D) or MFP-488-let-7a (E)-transfected DKs-8 cells. DAPI (gray) was used to stain nuclei. Selected areas are enlarged in the left bottom corner of each image. Numbered lines were scanned for the intensity of each fluorescence channel of the images and plotted at the right side.
(F) Representative merged images of PLA analysis of ER MCS in scrambled control (Sc) and VAP-A knockdown (KD1 and KD2) DKs-8 cells. DAPI, blue. Fluorescence dots per cell were calculated and plotted from sixty cells per condition from three independent experiments.
(G) Representative TEM images of control (Sc) and VAP-A KD2 (KD) DKs-8 cells. ER-endosome MCS are indicated by red asterisks. Quantification shows distance of ER to MVBs and percentage of MVBs with ER contacts (defined as MVBs with ≤40 nm distance from ER). Each circle represents an MVB. n = 61 and 59 MVBs from Sc and KD respectively from 10 (Sc) and 8 (KD) sections. Data were taken from three independent experiments.
(H) Tomographic reconstruction of an MVB/ER contact site observed in a DKs-8 (Sc) cell (see also Video S1). Three-dimensional segmentations of organelles depict MVB (light green), intraluminal vesicles (ILVs) (dark blue), and ER tubules (purple). Note the presence of an ILV still connected to the MVB limiting membrane at the ER contact site.
(I and J) Graphs of EV release rate from control and KD cells quantitated from NTA data and normalized based on final cell number and conditioned media collection time. Data from five independent experiments.
(K and L) Representative TEM images and size analysis for small EVs purified from DKs-8 control (Sc) and VAP-A KD2 (KD) cells. Quantification of a total of 150 vesicles per condition (control or KD) from three independent experiments.
(M) Graphs of total RNA concentration measured by NanoDrop (A260) for small and large EVs isolated from control (Sc) and VAP-A KD DKs-8 cells. Data from five independent experiments.
Bar graphs indicate mean +/− S.E.M. Scatter plots indicate median and interquartile range. *p<0.05, **p<0.01, ***p<0.001, ns, not significant. See also Figures S1 and S2, and Table S1.

