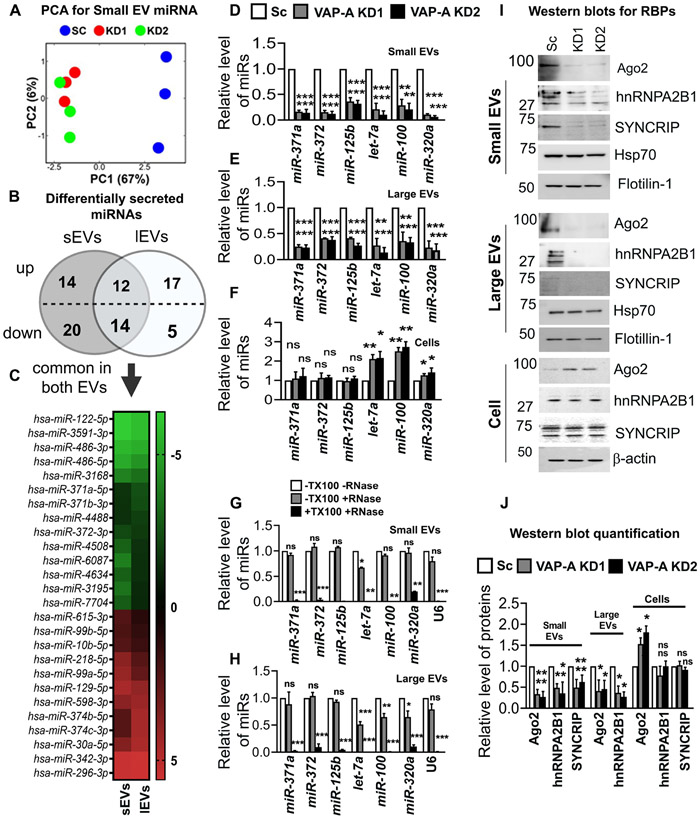
Figure 2: VAP-A regulates the miRNA composition of small and large EVs.
(A) Principal component analysis (PCA) of miRNA composition in small EVs showing segregation of KD (KD1 and KD2) from control (SC) data.
(B) Venn diagram depicts numbers of up- or down-regulated miRNAs in small and large EVs upon VAP-A knockdown. Levels (log 2-fold change) of miRNAs in small and large EVs were normalized to levels in their parental cells and then compared between control and VAP-A KD. miRNAs were considered significantly changed if either ≥ 2-fold or ≤ 0.5-fold enriched with a FDR value ≤ 0.05.
(C) Heat map represents levels (log 2-fold change) of differentially secreted 29 miRNAs in small and large EVs compared to their parental cells upon VAP-A KD. Green indicates downregulation in VAP-A KD EVs whereas red indicates upregulation.
(D-F) Relative levels of miR-371a, miR-372, miR-125b, let-7a, miR-100, miR-320a in control and VAP-A KD small EVs, large EVs and cells. Quantitative RT PCR was performed with 10 ng of total RNA. All experiments were from three biological replicates with three technical replicates. U6 snRNA was used to normalize Ct values.
(G-H) Relative levels of miRNAs (miR-371a, miR-372, miR-125b, let-7a, miR-100, miR-320a) in small and large EVs purified from control DKs-8 cells. Small and large EVs were treated with (+) or without (−) RNase in absence (−) or presence (+) of 1% Triton-X-100 (TX100) followed by total RNA isolation and qRT-PCR. All experiments were done in three biological replicates with three technical replicates
(I and J) Immunoblots show levels of RBPs (Ago2, hnRNPA2B1, SYNCRIP) and EV markers (flotillin-1, HSP70) in control (Sc) and VAP-KD EVs and cells. Quantification of immunoblot from three independent experiments were shown. Values were normalized by HSP70 (for small and large EVs) and by beta-actin (for cell lysates).
Data were plotted as mean +/− S.E.M. *p<0.05, **p<0.01, ***p<0.001. ns, not significant.
See also Figures S2 and S3.

