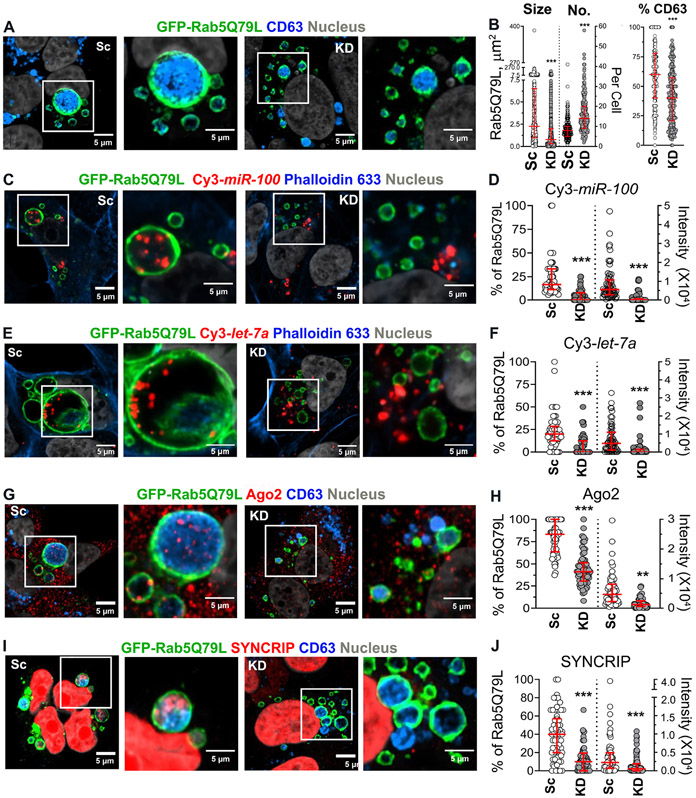
Figure 4. VAP-A regulates intraluminal filling of GFP-Rab5Q79L-positive MVBs.
(A) Representative merged images of GFP-Rab5Q79L-transfected DKs-8 cells with CD63 immunofluorescence staining. Selected areas are enlarged at the right. Sc, scrambled control; KD, knockdown.
(B) Quantitation of size and number/cell (No.) of GFP-Rab5Q79L rings and the percentage of CD63-positive GFP-Rab5Q79L rings. Each circle for size represents a single GFP-Rab5Q79L ring whereas each circle for number/cell represents a single cell. Each circle for the percentage of CD63-positive rings represents a single cell. n = 2328 and 4342 rings from 12 independent experiments for Sc and KD for the size measurement. n = 273 and 267 cells from 12 independent experiments for Sc and KD for the number of GFP-Rab5Q79L rings and the percentage of CD63-positive rings measurement.
(C and E) Representative merged images of GFP-Rab5Q79L and Cy3-miR-100 (C) or Cy3-let-7a (E)-co-transfected DKs-8 cells with Alexa633-conjugated phalloidin staining. Selected areas are enlarged at the right.
(D and F) Quantitation of the percentage of Cy3-miR-100 (D)- or Cy3-let-7a (F)-positive GFP-Rab5Q79L rings and the intensity of Cy3-miR-100 (D) or Cy3-let-7a (F) presented in GFP-Rab5Q79L rings. Each circle represents a cell. n = 63 and 64 cells (D) or 62 and 79 cells (F) from 3 independent experiments for Sc and KD, respectively.
(G and I) Representative merged images of GFP-Rab5Q79L-transfected DKs-8 cells with Ago2 (G) or Syncrip (I) and CD63 immunofluorescence staining. Selected areas are enlarged at the right.
(H and J) Quantitation of the percentage of Ago2 (H)- or Syncrip (J)-positive GFP-Rab5Q79L rings and the intensity of Ago2 (H) or Syncrip (J) presented in GFP-Rab5Q79L rings. Each circle represents a cell. n = 63 and 65 cells (H) or 67 and 63 cells (J) from 3 independent experiments for Sc and KD, respectively. All data were plotted with median and interquartile range. ** P < 0.01; *** P < 0.001 by the two-sided unpaired Mann-Whitney test.

