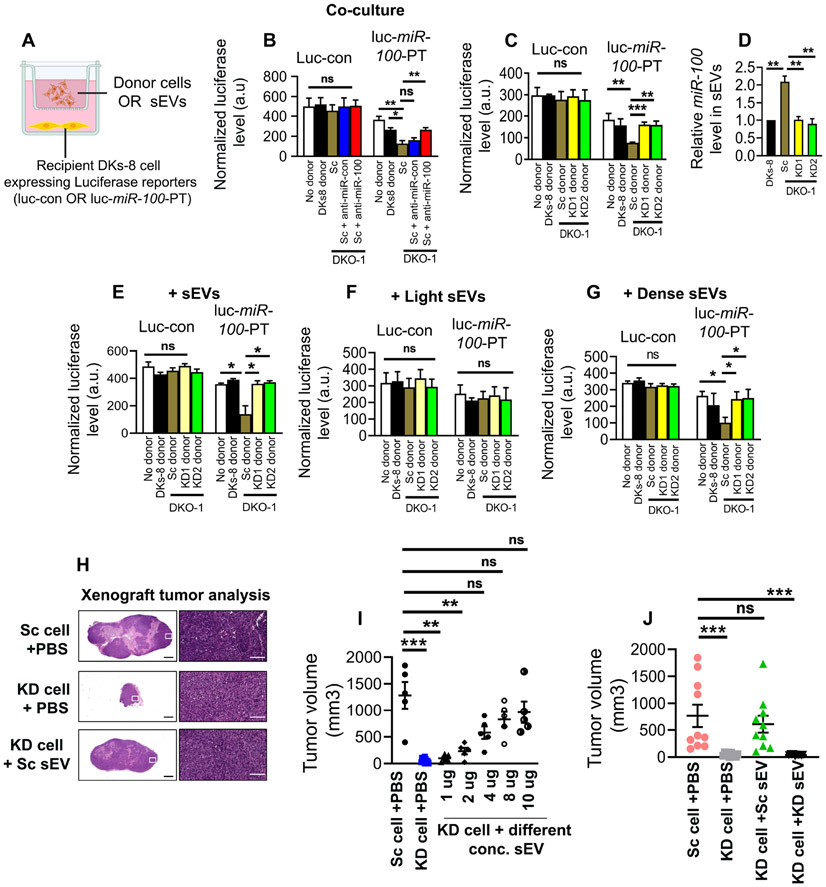
Figure 5: VAP-A controls miR-100 transfer and tumorigenic functions of EVs.
(A) Illustration of co-culture setup. Control (luc-control: luciferase with scrambled sites in the 3’ UTR) or miR-100 expressing luciferase reporters (luc-miR-100-PT: luciferase with three perfect miR-100 sites in the 3’ UTR) (Cha et al., 2015) were expressed in recipient DKs-8 cells that were plated in the bottom of a Transwell plate. Different donor cells (DKs-8, or control or VAP-A KD DKO-1 cells) were cultured in Transwell inserts. Alternatively, sometimes purified EVs were added instead of donor cells.
(B) Graph shows luciferase expression levels, normalized by co-expressed beta galactosidase, after lysis of recipient control or miR-100 reporter-expressing DKs-8 cells that were co-cultured with the indicated donor cells. miR-100 transfer was confirmed by expressing an antagomir to miR-100 (anti-miR-100) in DKO-1 cells, which blocked the reduction in luciferase caused by control DKO1 donors (anti-miR-control or Sc). Data from three independent experiments.
(C) Graph shows luciferase expression levels, normalized by co-expressed beta galactosidase, after lysis of recipient control or miR-100 reporter-expressing DKs-8 cells that were co-cultured with the indicated donor cells. Data from three independent experiments.
(D) Relative miR-100 levels in small EVs isolated from different donor cells, quantified by qRT-PCR. Data from three independent experiments.
(E-G) Relative luciferase expression in recipient DKs-8 cells after addition of small EVs purified from donor cells, as indicated. (E), small EVs purified by cushion density gradient. (F and G) Light EVs or Dense EVs purified as in (Kowal et al., 2016).
Luciferase data (B-G) from three independent experiments with three technical replicates per condition each time. Luciferase data were analyzed by unpaired Mann-Whitney test. *p<0.05, **p<0.01, ***p<0.001. ns, not significant.
(H-J) Control (Sc) and VAP-A KD2 (KD) DKO-1 cells were mixed with PBS (+PBS) or small EVs (+sEV) and injected subcutaneously in nude mice and allowed to grow for 3 weeks, with injection of PBS or EVs twice a week. (H) Representative images of Hematoxylin and Eosin stained sections of tumors. (I) Tumor volume after injecting PBS or different concentrations of small EVs purified from control (Sc) DKO-1 cells. Each circle represents an animal (n≥5 per condition). (J) Tumor volume for control and KD tumors injected with PBS, or 10 μg control or KD sEVs, as indicated. Each condition from ten animals. Some data points in Figure H and I are in common. Tumor data were compared by unpaired Mann-Whitney test.
*p<0.05, **p<0.01, ***p<0.001. ns, not significant.

