
Figure 5. Graphs arranged according to the resuscitation protocol, guidelines‐driven (GD), amplitude spectral area (AMSA)–driven shocks (ADS), and AMSA‐driven shocks and epinephrine (ADSE), showing electrical burden calculated as described in the text (A) and adrenergic burden calculated as described in the text (B).
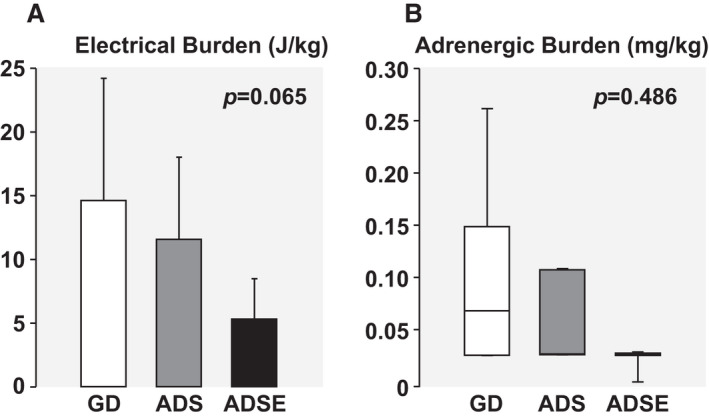
Differences among groups were analyzed by 1‐way ANOVA using the Holm‐Sidak test for pairwise comparisons if the data were normally distributed; otherwise, the Kruskal‐Wallis test on ranks with Tukey test for pairwise comparisons was used, correspondingly showing means±SD with data shown in bar graphs or median (quartile 1–quartile 3) with data shown in box plots. The P value for the overall test is shown in the graph.