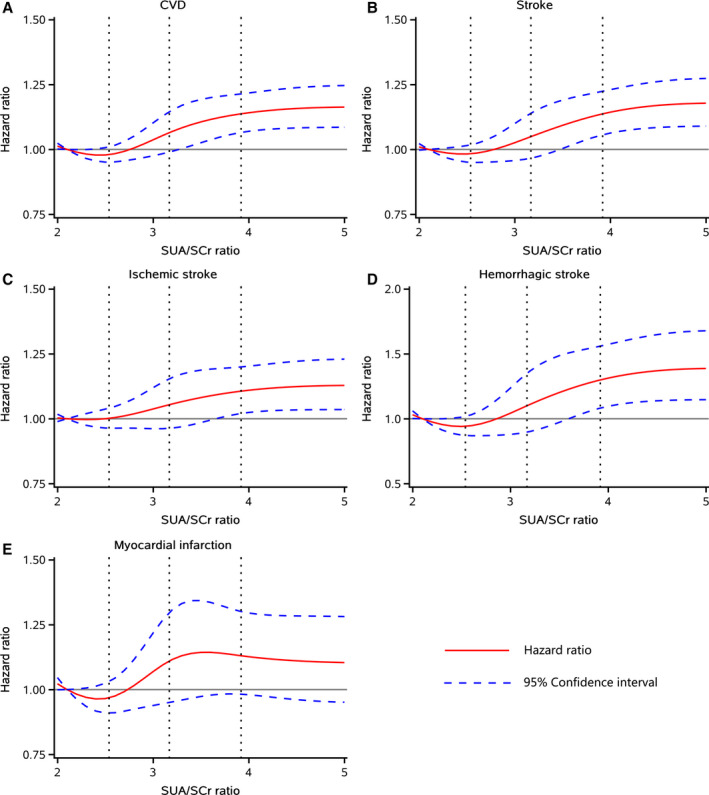
Figure 2. HRs and 95% CIs for SUA/SCr with risk of (A) CVD and (B–E) its subtypes by using restricted cubic spline regression with 5 knots with placed at the 5th, 25th, 50th, 75th, 95th percentiles of SUA/SCr.

The red line represented HR and blue lines represented 95% CI. Adjusted for age, sex, body mass index, education, income, smoke, drink, physical activity, hypertension, diabetes, dyslipidemia, proteinuria, diuretics, angiotensin converting enzyme inhibitors/angiotensin II receptor blockers treatment, systolic blood pressure, diastolic blood pressure, fasting blood glucose, total cholesterol, and high sensitivity C‐reactive protein. CVD indicates cardiovascular disease; HR, hazard ratio; and SUA/SCr, serum uric acid to serum creatinine ratio.
